usptoInfluenza.csv |
|
Time frame: | 1865-2008 |
Region(s): | Miscellaneous |
Topical Area(s): | Influenza |
Analysis Type(s): | Geospatial Analysis |
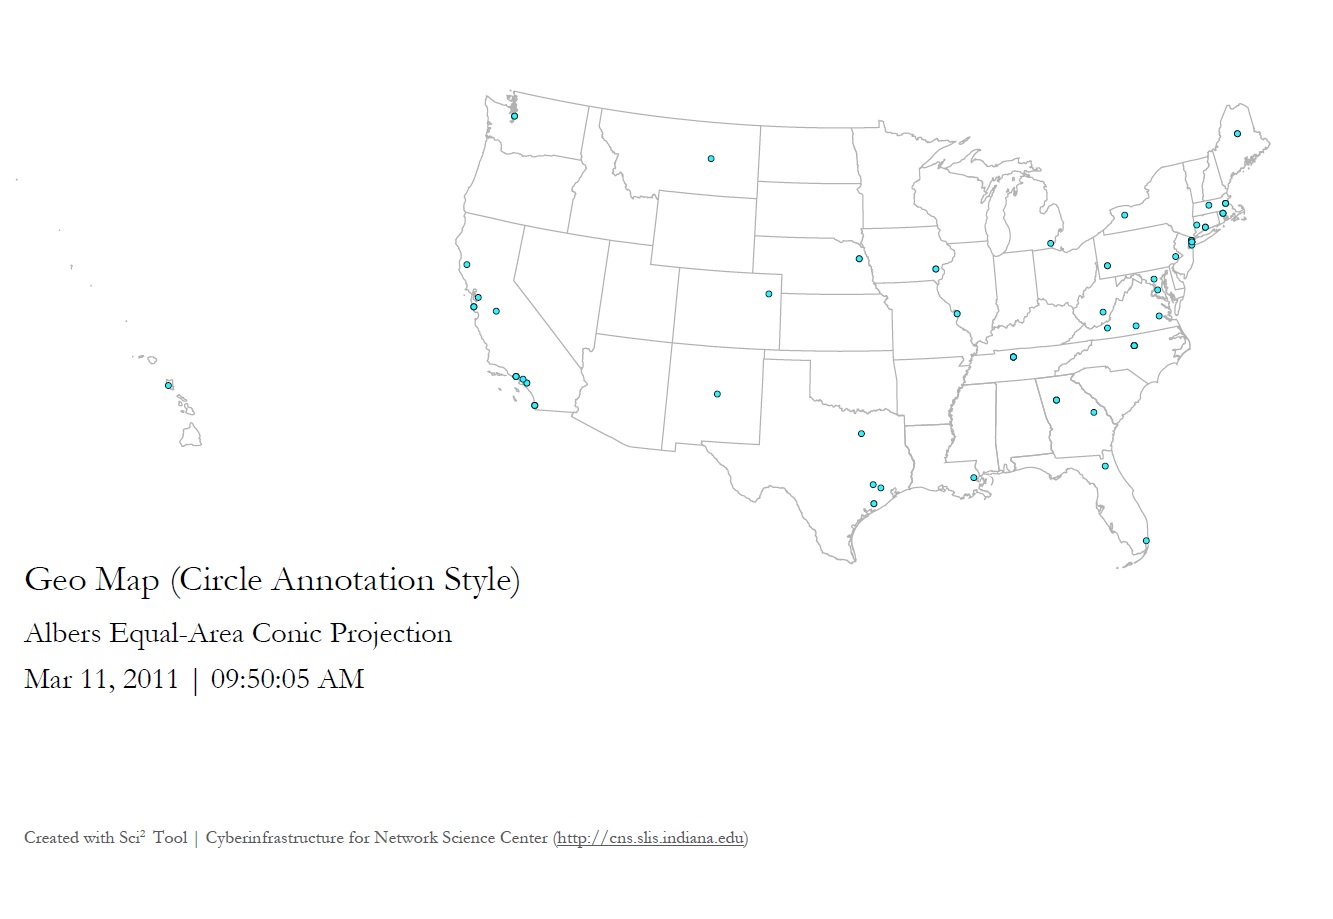
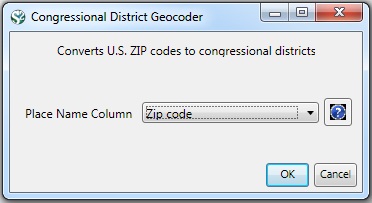
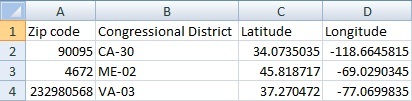
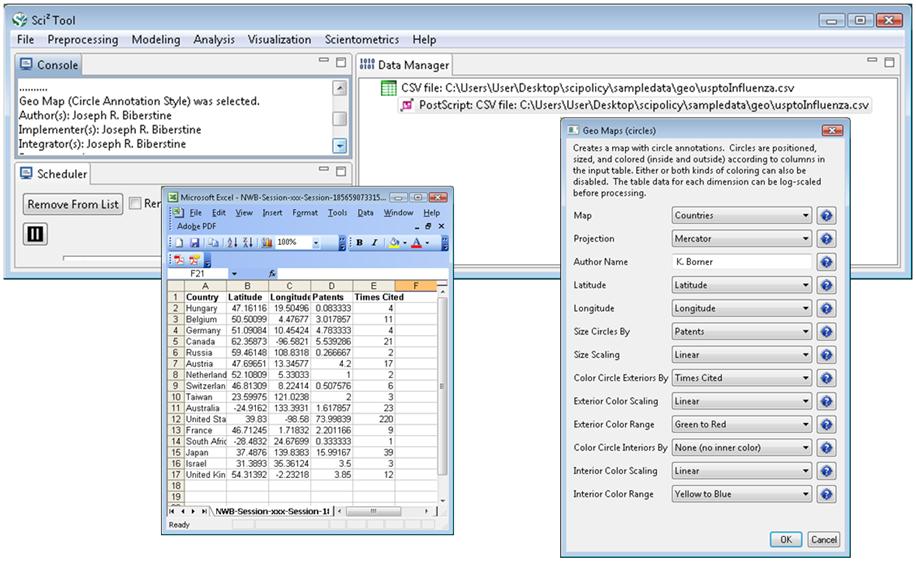
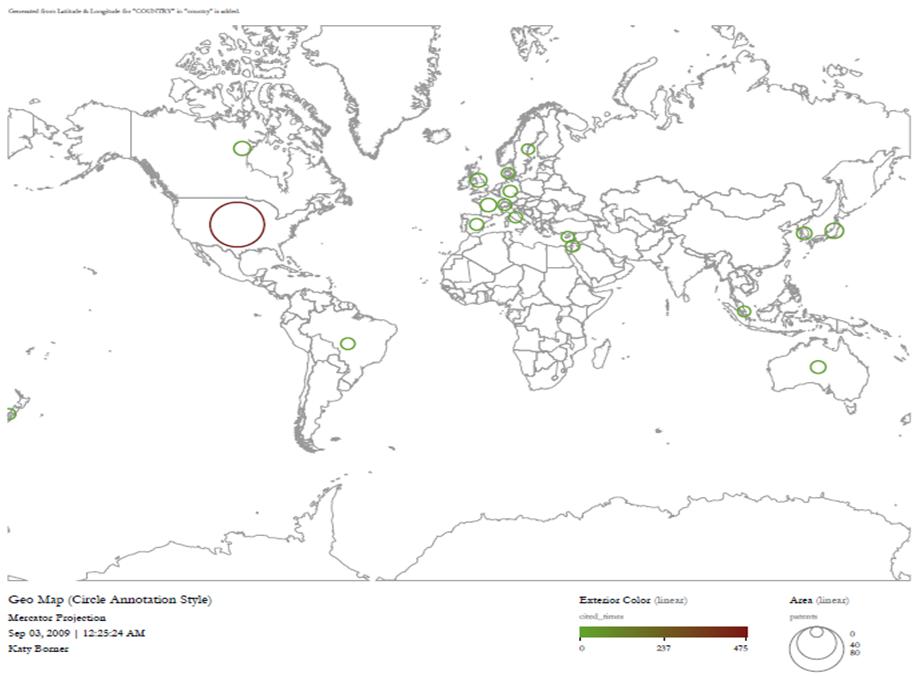
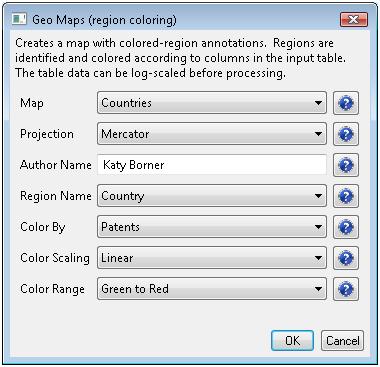
The file 'usptoInfluenza.csv' was generated with an SDB search for patents containing the term "Influenza", and was heavily modified to produce a simple geographic table. Load it using 'File > Load'' and following this path: 'yoursci2directory/sampledata/geo/usptoInfluenza.csv' (if the file is not in the sample data directory it can be downloaded from 2.5 Sample Datasets). Then select "Standard csv format." See the data format in Figure 5.37 (left). Once loaded, select the dataset in the Data Manager and run Visualization > Geospatial > Proportional Symbol Map using the parameters in Figure 5.37 (right). The tool will output a PostScript visualization which can be viewed using GhostView (see section 2.4 Saving Visualizations for Publication and Figure 5.38).
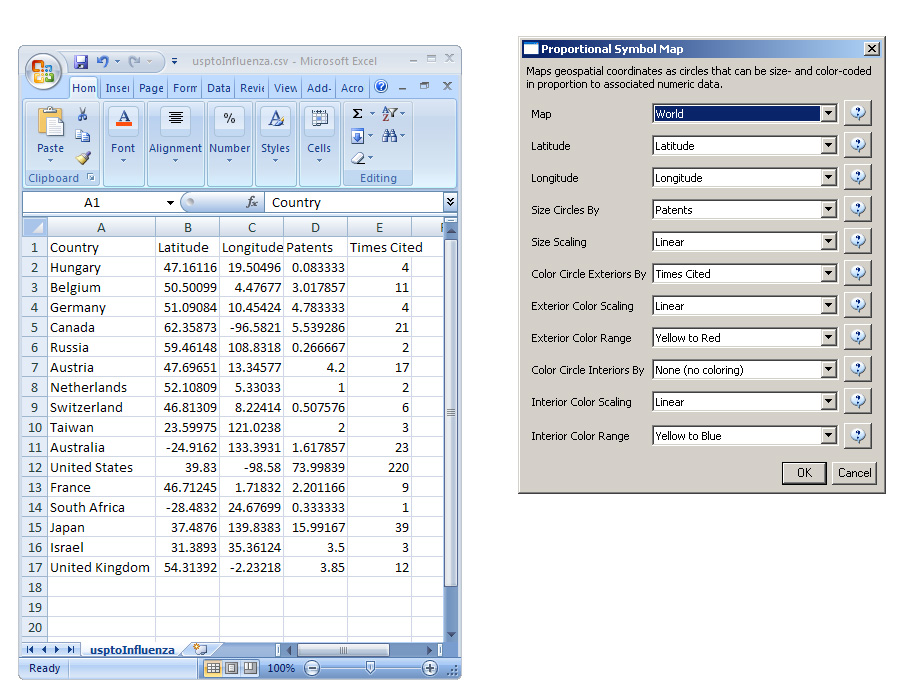
Figure 5.37: Geospatial workflow with usptoinfluenza.csv data (left) and Geo Map parameters (right).
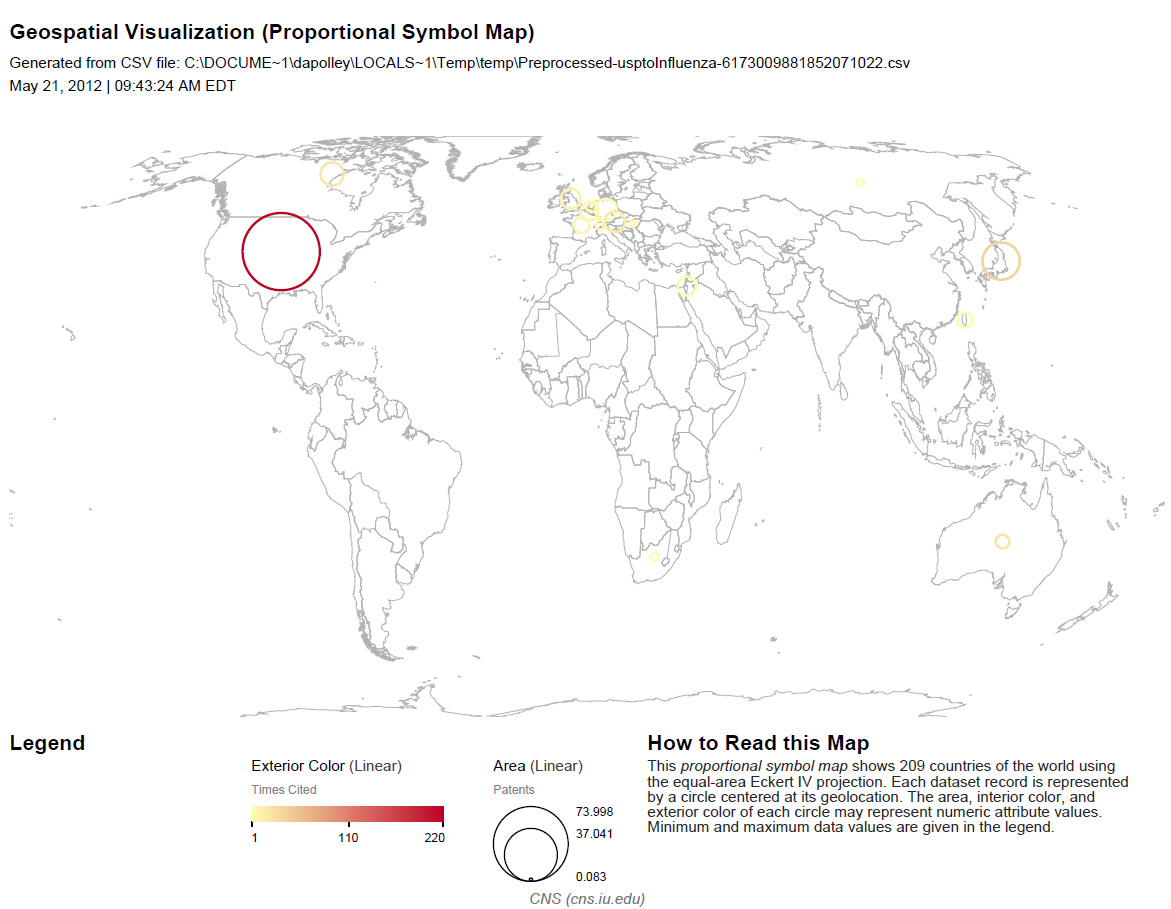
Figure 5.38: Geospatial map (circle annotations) of USPTO patent influemza data
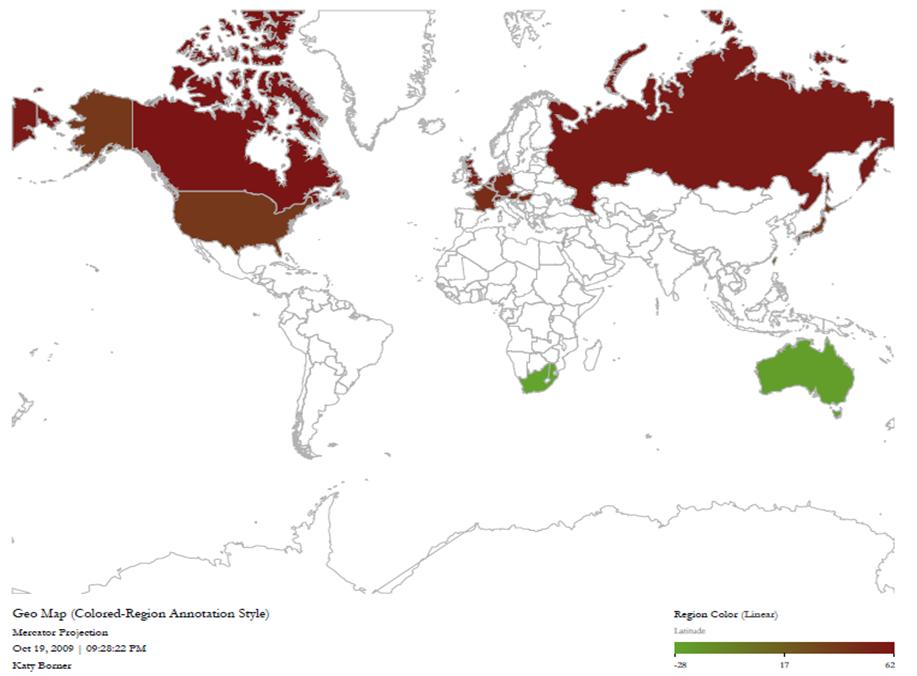
To create a geospatial map with region coding, select usptoinfluenza.csv once again and then select Visualization > Geospatial > Choropleth Map. Use the following parameters:
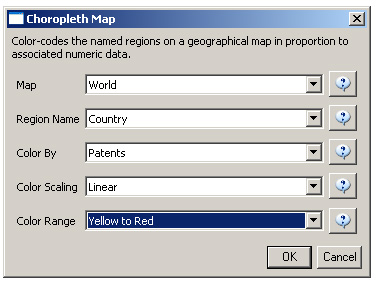
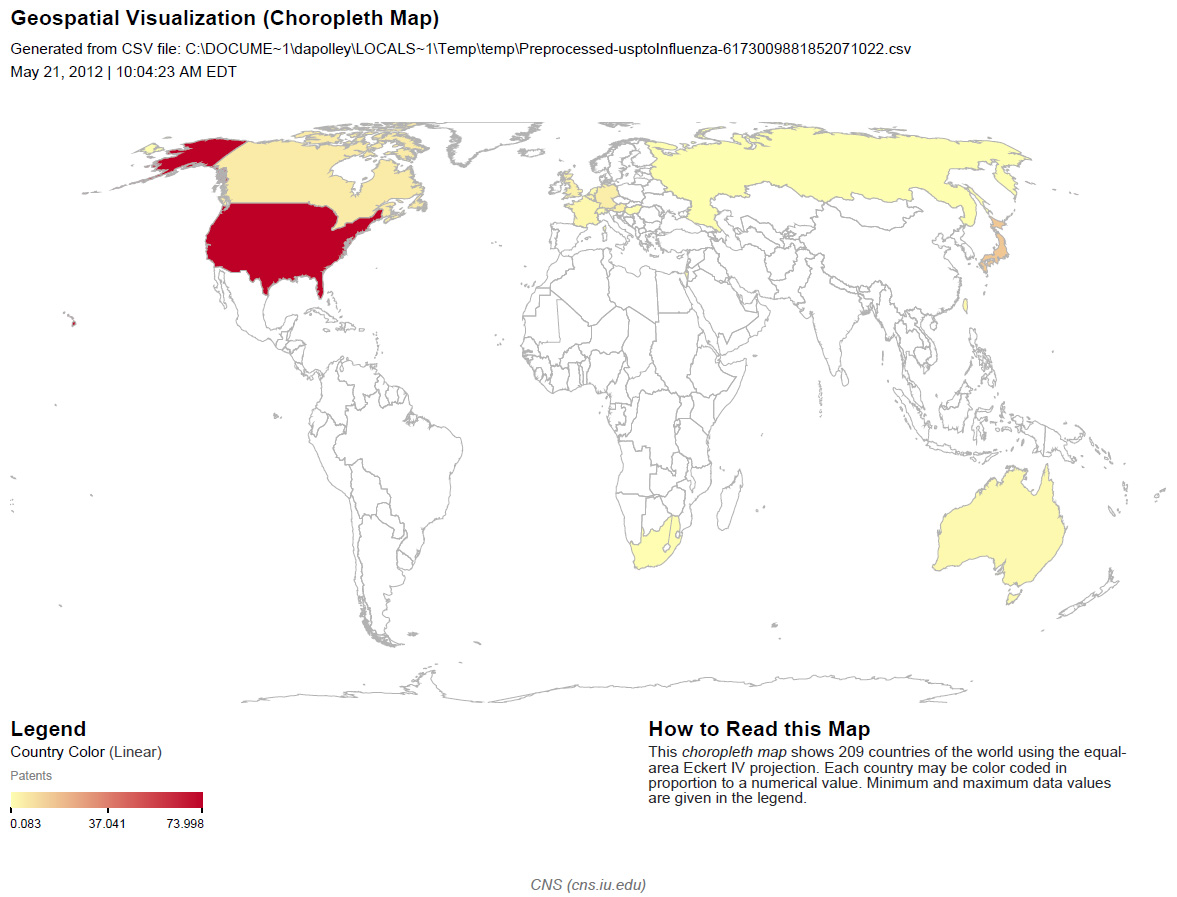
Figure 5.39: Geospatial map (Colored-Region) of USPTO Patent influenza data.
To see the log file from this workflow save the 5.3.1 Geo USPTO (SDB Data) log file.
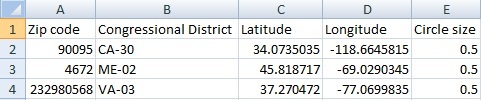
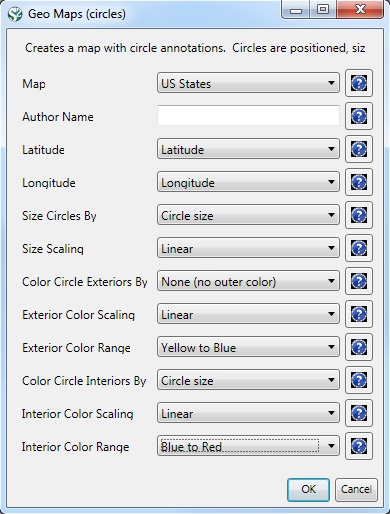
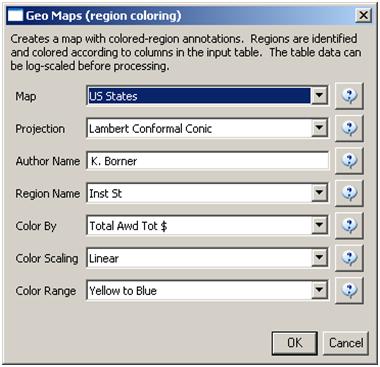
One can also create a US Geo Map with customized data by running the same workflow but selecting "US States" in "Map", see below.
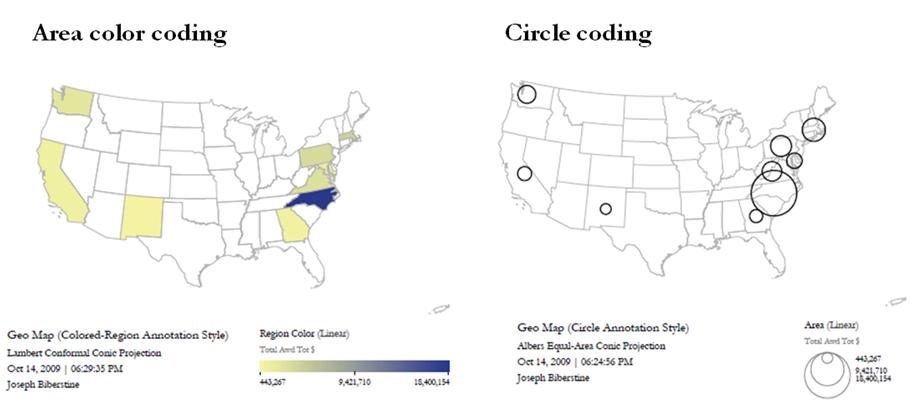
Figure 5.40: US map with area color coding and circle coding for aggregated data over states.
There are two available size scaling options, "Linear" and "Logarithmic". We recommend using logarithmic scaling for larger datasets.
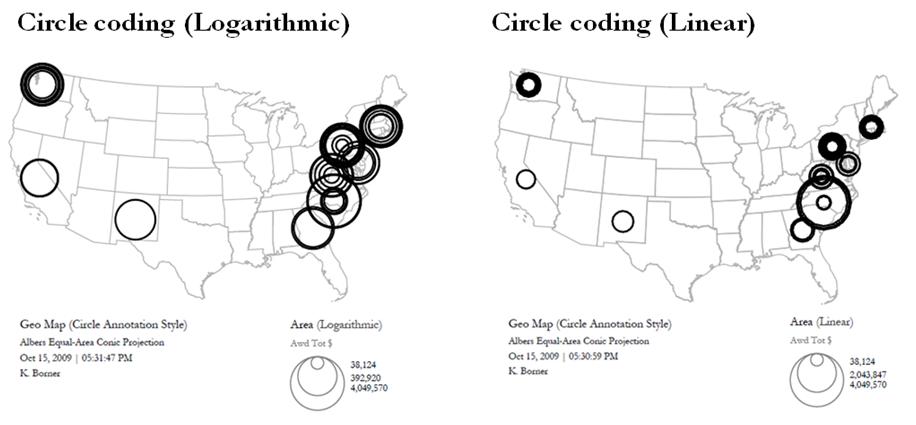
Figure 5.41: US geospatialmap of state-level data with logarithmic circle size scaling (left) and circle linear size scaling (right).