| Scanning Directory Structures | |
|---|---|
| Region(s): | N/A |
| Topical Area(s): | Hierarchical Data |
| Analysis Type(s): | Radial Tree/Graph (prefuse alpha), Tree View (prefuse beta), and Tree Map (prefuse beta) |
5.1.5.1 Visualizing the Sci2 Directory
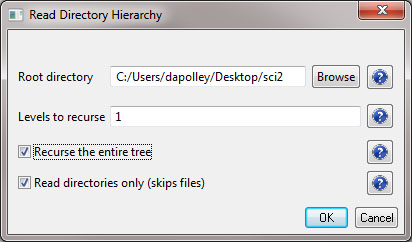
Many data sets represent a hierarchy of categories. Think of the directories on your computer, many of which consist of sub-directories and files. Sci2 allows for the visualization of this hierarchical data in the form of trees. Using Sci2 you can scan any directory on your computer or any network drive you have mapped to your machine. For example, run 'File > Read Directory Hierarchy' and select the Sci2 directory from where you have it installed on your machine and input the following parameters:

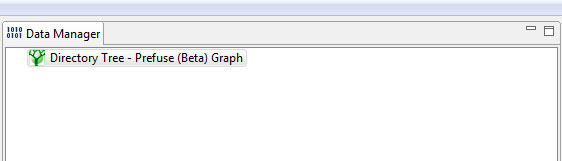
You have several options when creating your directory tree. You can specify exactly how many levels to recurse, this is good if you know how many levels of the hierarchy you want to visualize.You may not know how many levels there are in the directory structure you are scanning, in this case you can select to recurse the entire tree. However, you should be careful as this can be time consuming for large directory structures. Finally, you can choose to ignore files in the directory structure, focusing simply on the directories themselves.The result of scanning the Sci2 directory will be a Directory Tree in the data manager:
This file is formatted in TreeML (.xml) a fairly way easy to implement schema written in XML. TreeML files consist of a list of declarations and a series of branches ending in leaves. Below is a sample of the Sci2 Directory Structure TreeML file. The <branch> tag indicates a node that has children in the hierarchy, whereas the <leaf> tag indicates a node that has no children, so a node at the lowest level of the hierarchy:
<tree>
  <declarations>
    <attributeDecl name="label" type="String"/>
  </declarations>
  <branch>
    <attribute name="label" value="sci2"/>
    <branch>
      <attribute name="label" value="configuration"/>
      <leaf>
        <attribute name="label" value=".settings"/>
      </leaf>
      <branch>
        <attribute name="label" value="org.eclipse.core.runtime"/>
        <leaf>
          <attribute name="label" value=".manager"/>
        </leaf>
      </branch>
      <branch>
        <attribute name="label" value="org.eclipse.equinox.app"/>
        <leaf>
          <attribute name="label" value=".manager"/>
        </leaf>
      </branch>
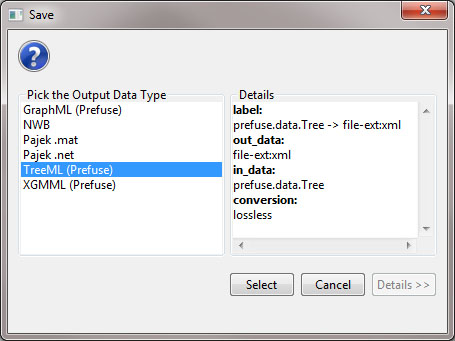
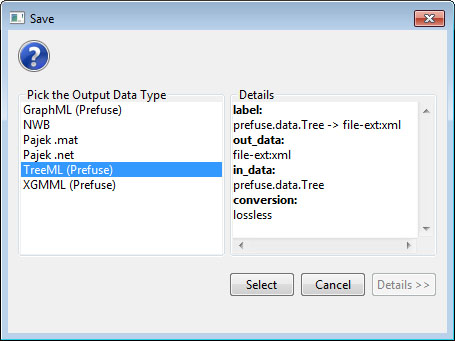
To see the whole TreeML file righ-click on the "Directory Tree - Prefuse (Beta) Graph" file in the data manager and save the file as a TreeML (Prefuse) file:
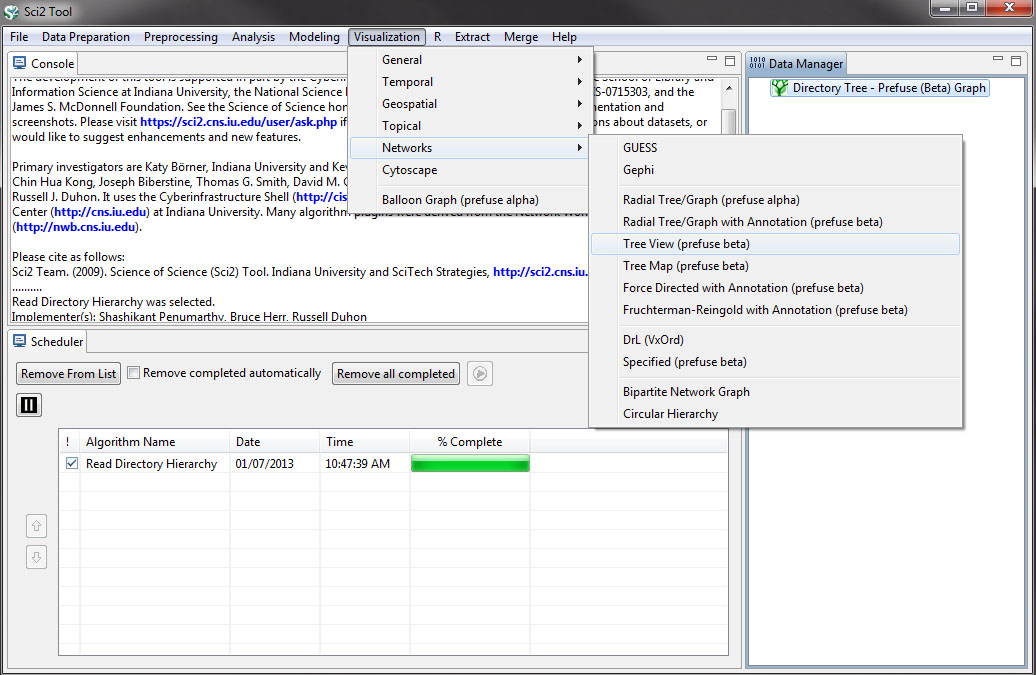
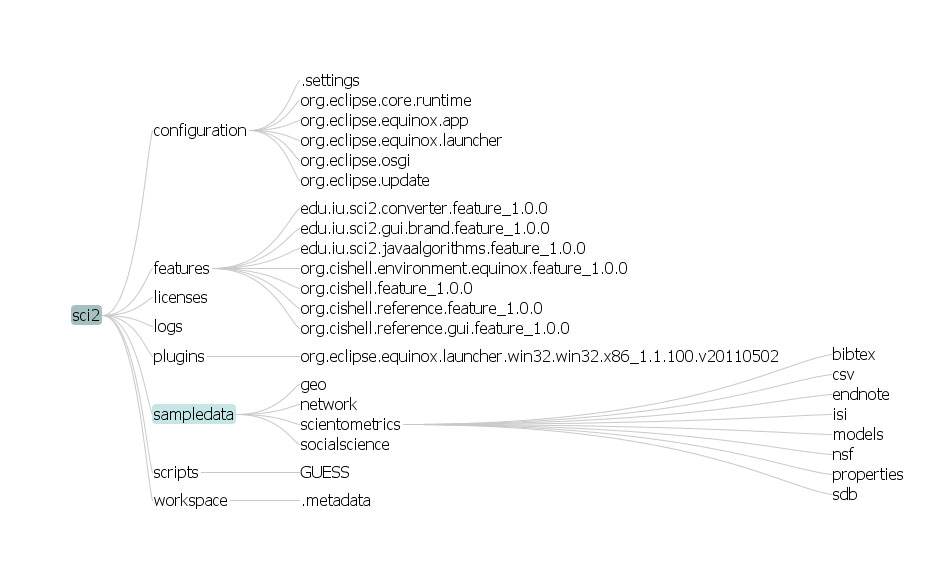
This will save a .xml file to the location you selected. You can open and edit XML files with a variety of programs such as Adobe Dreamweaver or Oxygen XML Editor, but any text editor will suffice. To visualize the tree structure select "Directory Tree - Prefuse (Beta)" and run 'Visualization > Networks > Tree View (prefuse beta)':
The resulting visualization will open in Prefuse:
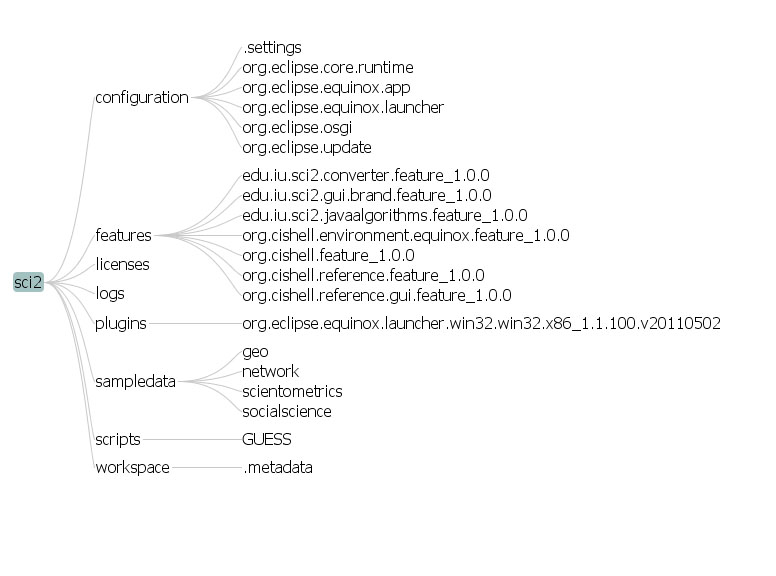
The initial visualization displays the first three levels of the directory structure. If you want to explore deeper in the directory structure, click on any directory in that level to see the directories nested below the level you have selected:
If you are searching for a particular directory in a large hierarchy there is a search bar in the lower left-hand side of the Prefuse screen that allows users to find exact matches for search terms entered:

In addition to viewing hierarchical data structures in the Tree view, you can visualize them as Tree Maps by selecting the "Directory Tree - Prefuse (Beta)" and running 'Visualization > Networks > Tree Map (prefuse beta)':

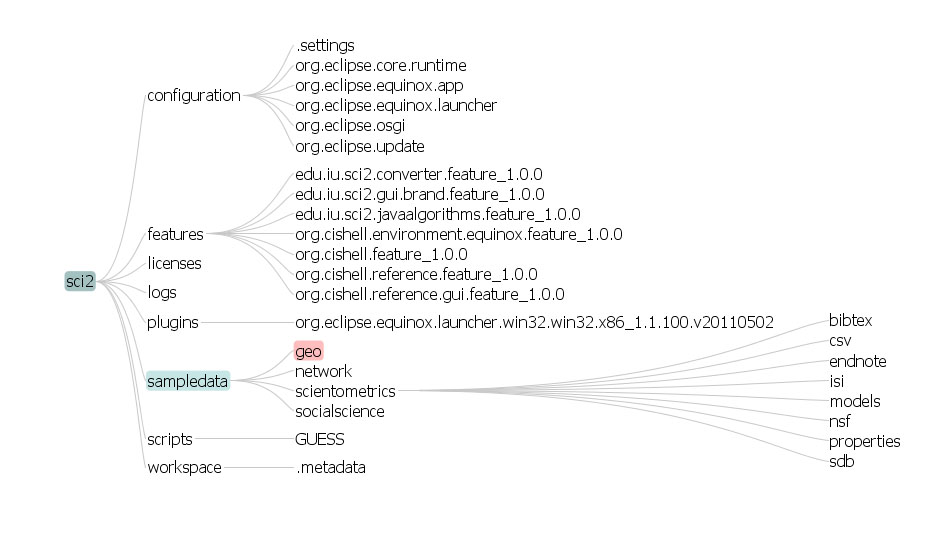
To learn more about tree maps see the documentation on our implementation of this algorithm click here. Finally, you can visualize the Sci2 directory structure as a graph you can do so by running 'Visualization > Networks > Radial Tree/Graph (prefuse alpha)' and the result will look similar to this:
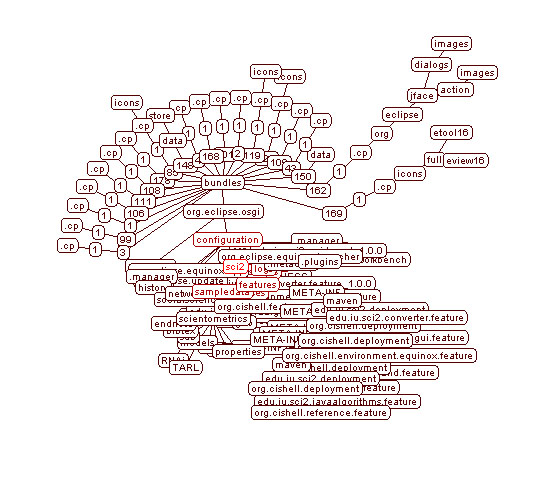
By selecting a node in the graph, each of its children in the hierarchy will be displayed in a darker red color. Anytime a node is selected the graph will rearrange to show the nodes directly beneath that node in the hierarchy. However, the radial tree view can be difficult to read for large directory structures.
5.1.5.2 Creating Your TreeML File
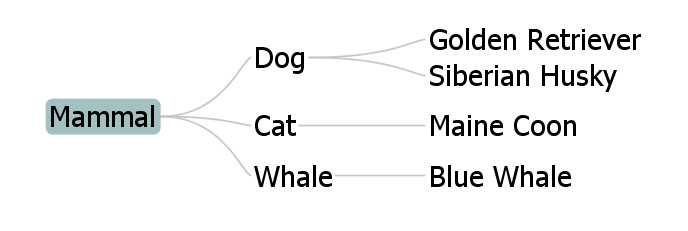
Before you create your TreeML file, it is a good idea to sketch it out first. Below is an example of the hierarchy that we will create using TreeML and then visualize using the "Tree View (prefuse beta)" visualization:
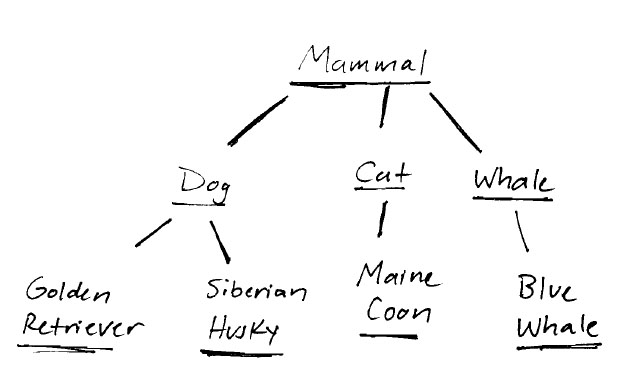
You can create your own TreeML file by using any text editor of your choice. The code below was created in Adobe Dreamweaver, but you can accomplish the same thing with any simple text editor like Notepad:
<?xml version="1.0" encoding="utf-8"?>
<tree>
<declarations>
<attributeDecl name="label" type="String"/>
</declarations>
<branch>
<attribute name="label" value="Mammal"/>
    <branch>
    <attribute name="label" value="Dog"/>
        <leaf>
        <attribute name="label" value="Golden Retriever"/>
        </leaf>
        <leaf>
        <attribute name="label" value="Siberian Husky"/>
        </leaf>
    </branch>
    <branch>
    <attribute name="label" value="Cat"/>
        <leaf>
        <attribute name="label" value="Maine Coon"/>
        </leaf>
    </branch>
    <branch>
    <attribute name="label" value="Blue Whale"/>
    </branch>
</branch>
</tree>
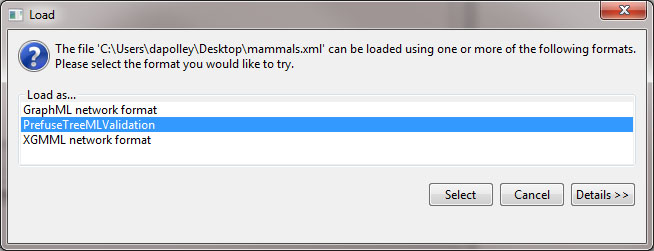
Once you have finished creating the hierarchy in the text editor of your choice, save the file as an XML (.xml) file and load it into Sci2 as PrefuseTreeeMLValidation:

After loading the file, you can visualize the heirarchy by running "Visualization > Networks > Tree View (prefuse beta)":

The resulting visualization should look something like this: