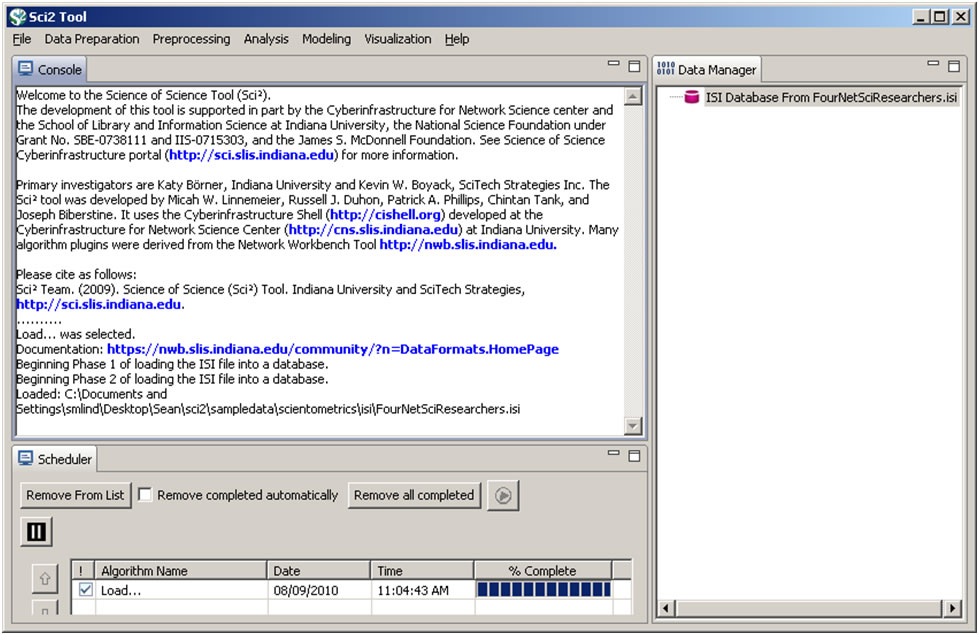
The general Sci2 Tool user interface is shown in Figure 2.3.
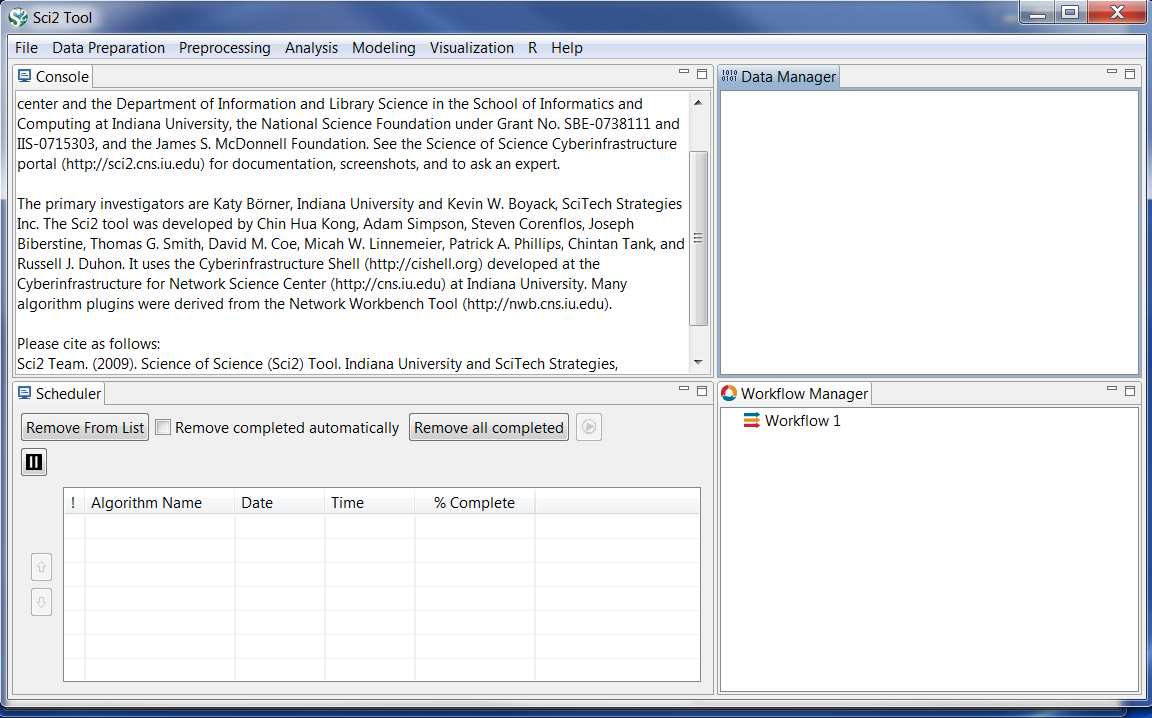
Figure 2.1: Sci2 Tool Interface: the menu bar, console, data manager, scheduler and workflow manager
2.2.1 Menus
The Sci2 Tool menu structure is arranged to allow users to follow a generalized information visualization workflow, which runs from left to right.

Figure 2.2: The Sci2 Menu Bar highlighted in red box.
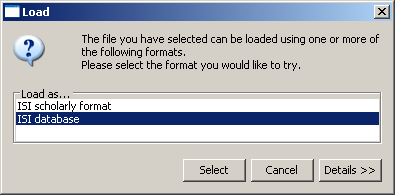
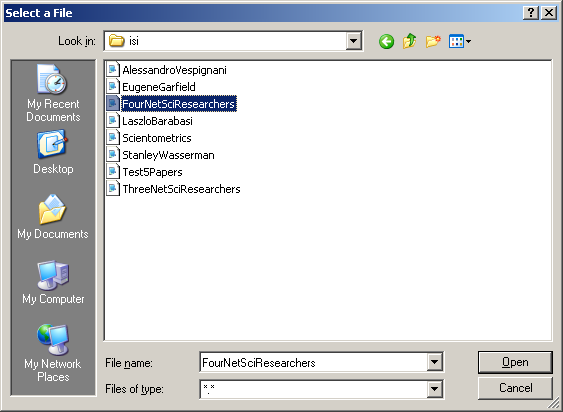
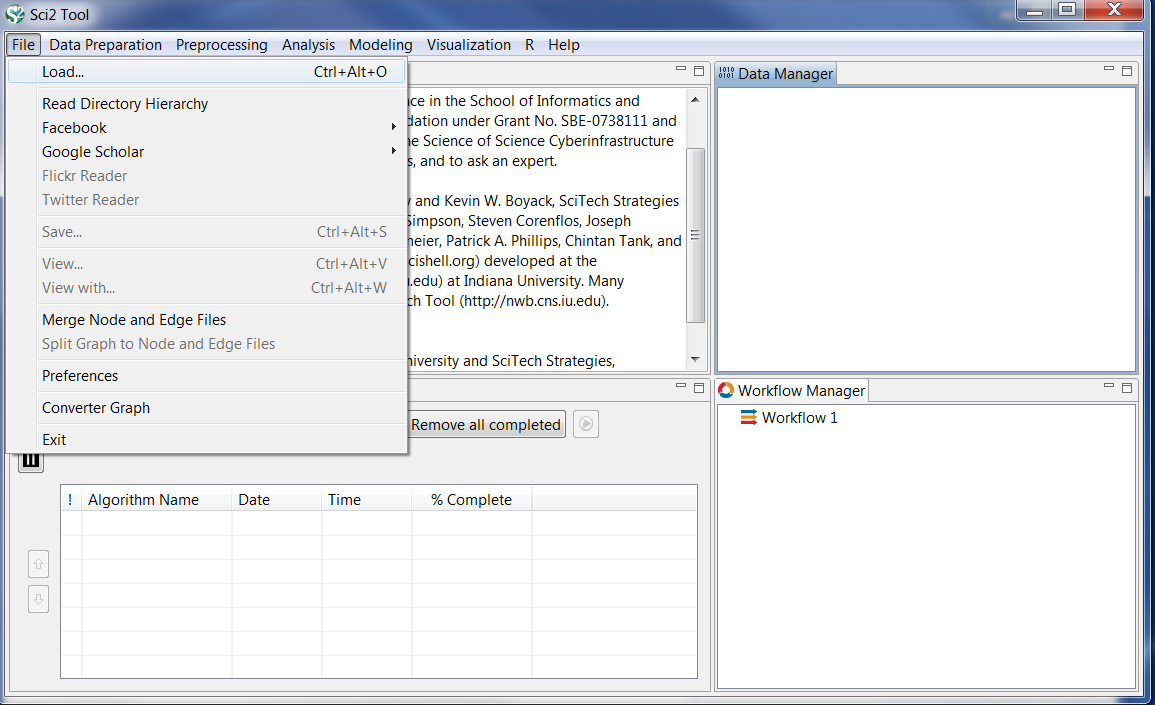
2.2.1.1 File
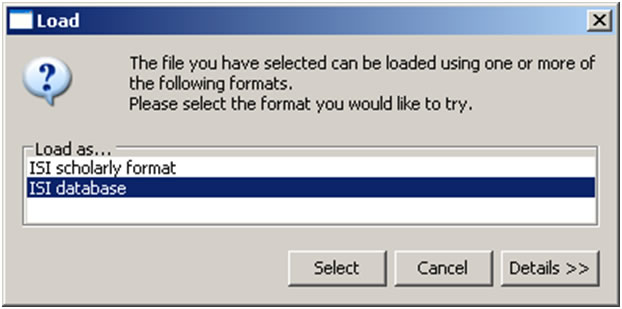
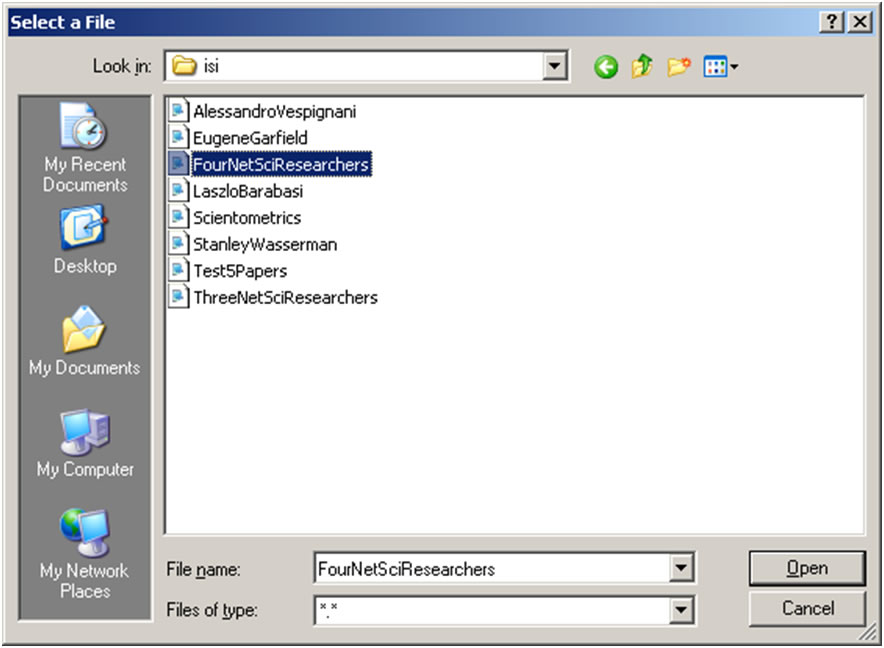
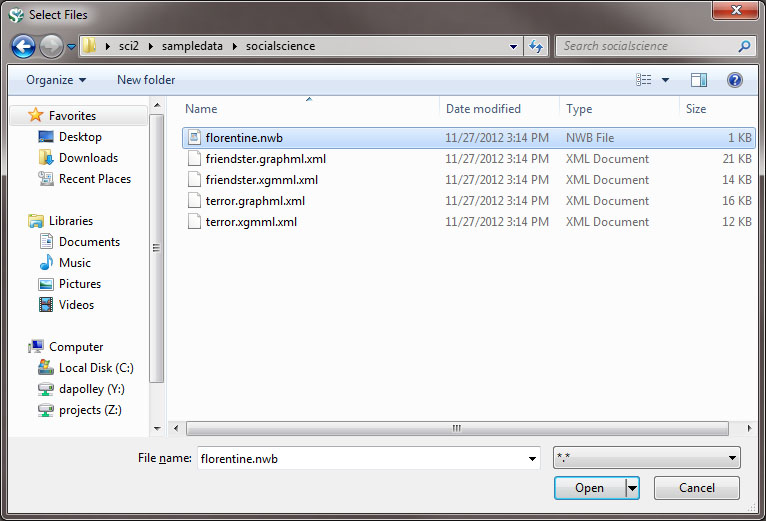
The 'File' menu on the left allows a user to load data in a number of formats, which can then be prepared, preprocessed, analyzed, and finally visualized. Users also have the option of modeling new networks or finding help online.

Figure 2.3: The File Menu with the 'Load' used to select and load a file into Sci2 data manager
The 'File' menu functionality includes loading multiple data formats (see section 2.3 Data Formats for details), loading ISI and NSF data, saving and viewing results, and merging or splitting node and edge files.
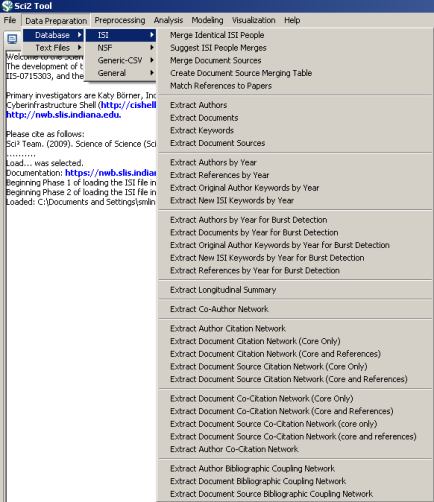
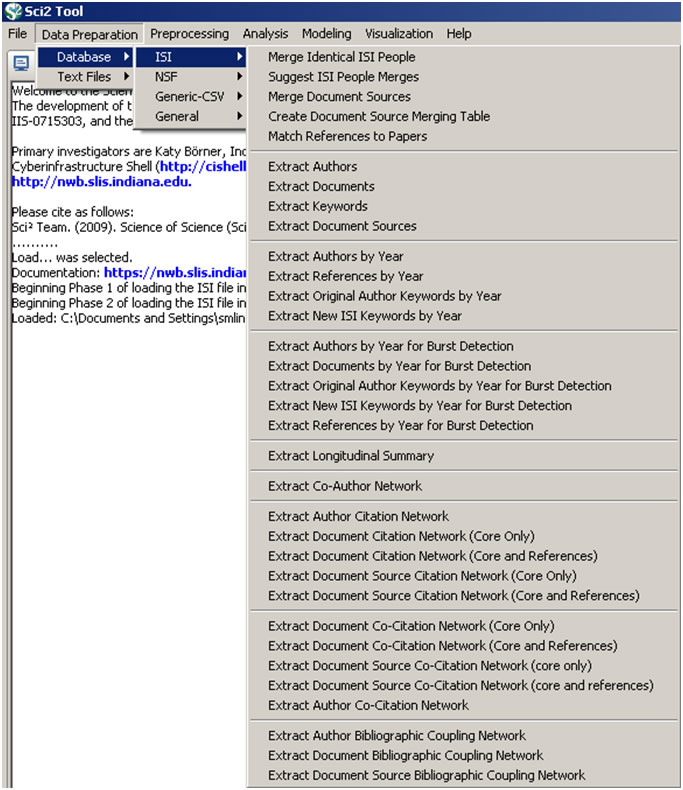
2.2.1.2 Data Preparation
After loading a file, use options in the 'Data Preparation' menu to clean the data and create networks or tables which can be used in the preprocessing, analysis, and visualization steps. The options in the top of the menu are for any table-based datasets (like csv files) and are used to extract networks. The 'Data Preparation > Database' menu is specifically for ISI or NSF data previously loaded into a database. Find detailed information on each menu item in section 3.1 Sci2 Algorithms and Tools.
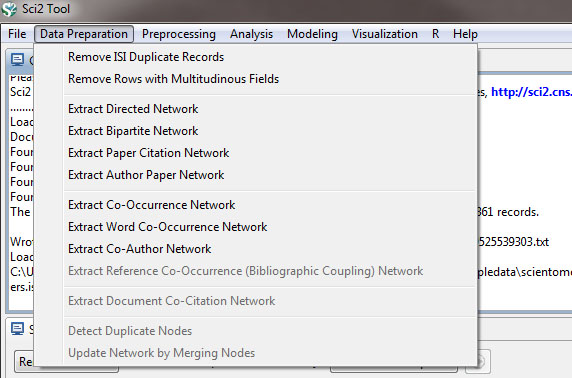
Figure 2.4: Data Preparation options
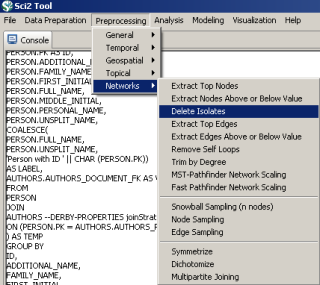
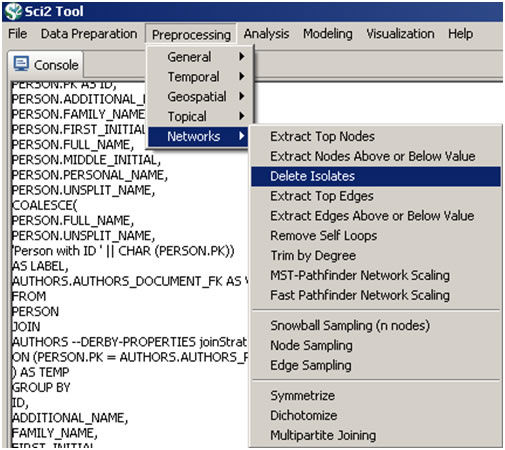
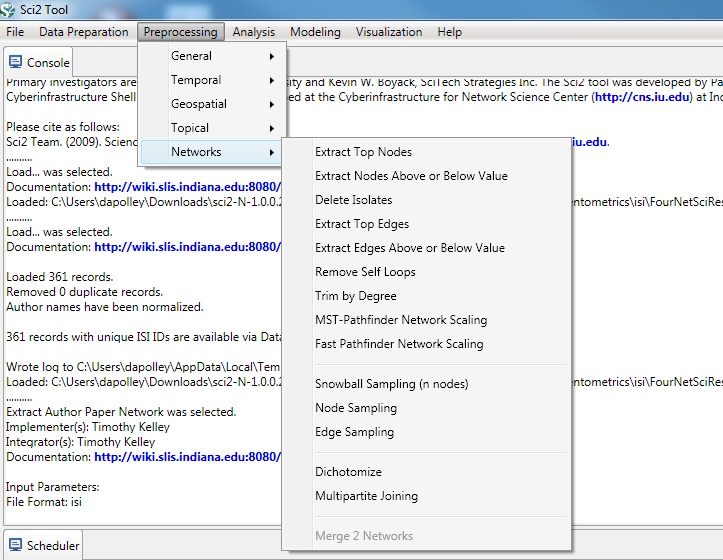
2.2.1.3 Preprocessing
Use preprocessing algorithms to prune or append networks or tables before analyzing and visualizing them. The menu is separated by domain, and most simple tasks require staying within the same domain. For example, to visualize a co-authorship network, only use algorithms within the 'Networks' domain under 'Preprocessing', 'Analysis', and 'Visualization'. Similarly, a geographic map requires only 'Geospatial' algorithms. Find detailed information on each menu item in section 3.1 Sci2 Algorithms and Tools.

Figure 2.5: Preprocessing options
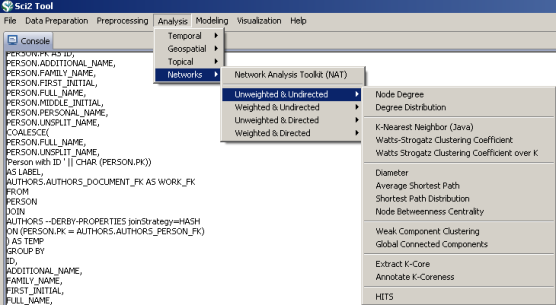
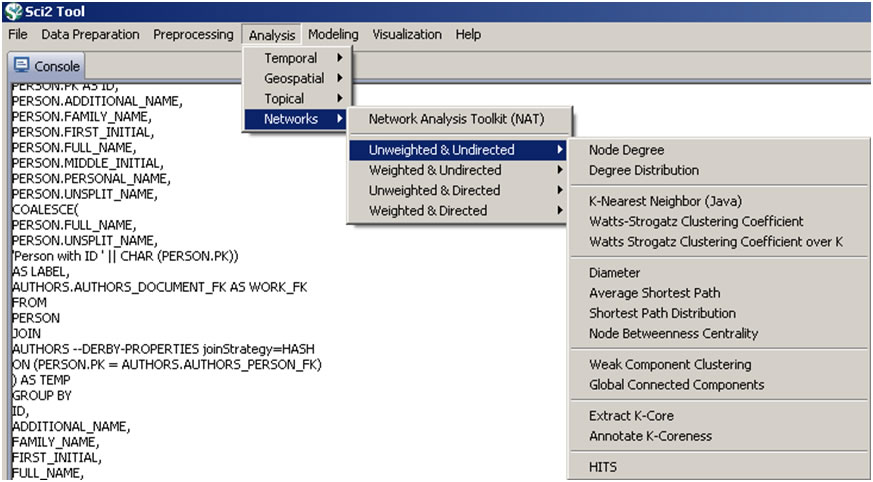
2.2.1.4 Analysis
Once data is loaded, prepared, and processed with whatever features needed, analysis is possible in each of the four domains: temporal, geospatial, topical, or network.
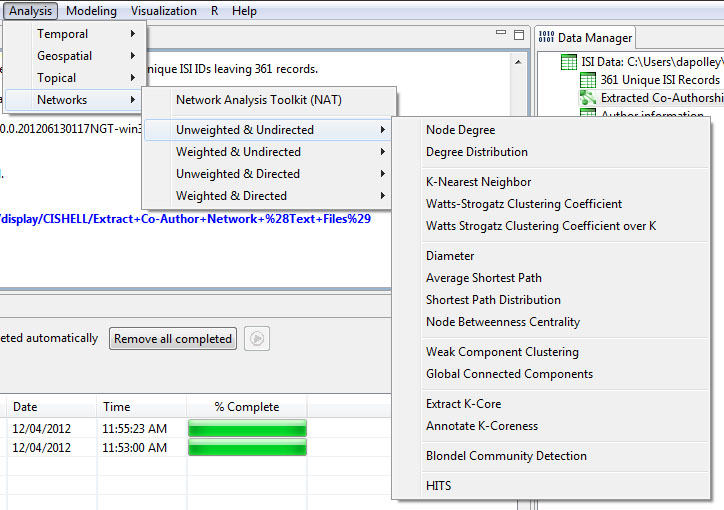
Figure 2.6: Analysis options
Analysis results can be used on their own or in conjunction with visualizations to gain insight into a dataset. The Sci2 Tool features predominantly network analysis algorithms, however the tool also supports geocoding of table data and burst analysis for topical or temporal studies. Find detailed information on each menu item in section 3.1 Sci2 Algorithms and Tools
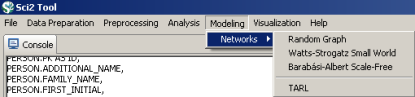
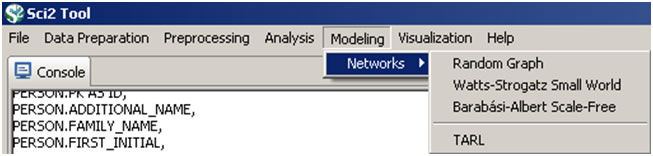
2.2.1.5 Modeling
The Sci2 Tool supports the creation of new networks via pre-defined models. Learn more about modeling in section 4.10 Modeling (Why?).
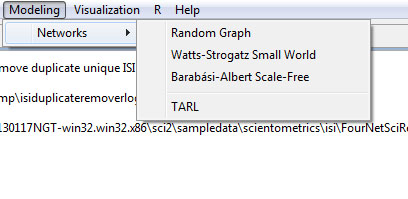
Figure 2.7: Modeling options
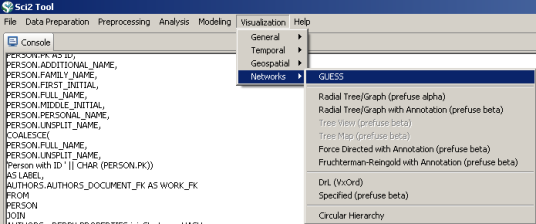
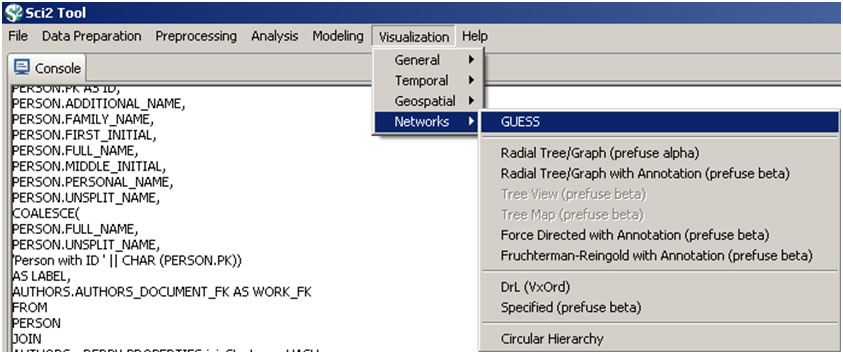
2.2.1.6 Visualization
Once all previous data steps are complete, the Sci2 Tool can visualize the results. The most popular choice for visualizing networks is the GUESS toolkit, or DrL for much larger scale networks. Geocoded data can be represented on a map of the world or the United States, and temporal or topical data can be viewed using the horizontal bar graph. Find detailed information on each menu item in section3.1 Sci2 Algorithms and Tools.
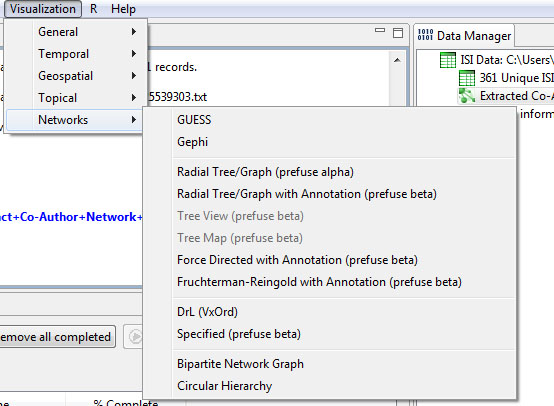
Figure 2.8: Visualization options
2.2.1.7 R Bridge
The 'R' menu provides you with a list of options to instantiate and work with your installation of R. For more information on using R with Sci2 see 4.5 Statistical Analysis and Profiling
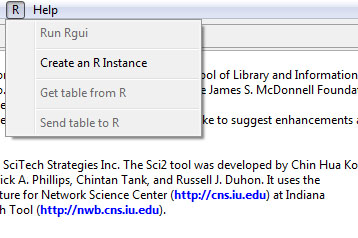
Figure 2.9: R options
2.2.1.8 Help Console
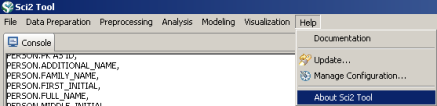
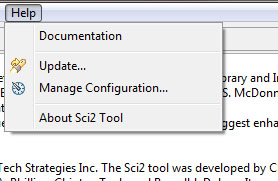
The 'Help' menu leads to online documentation, advanced tool configuration, and detailed development information.
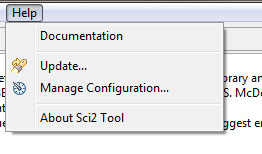
Figure 2.10: Help options
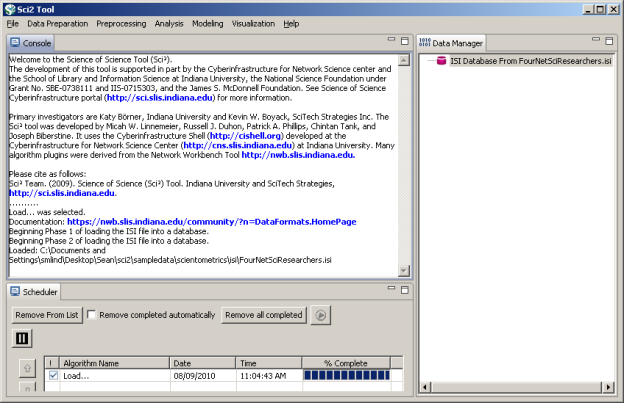
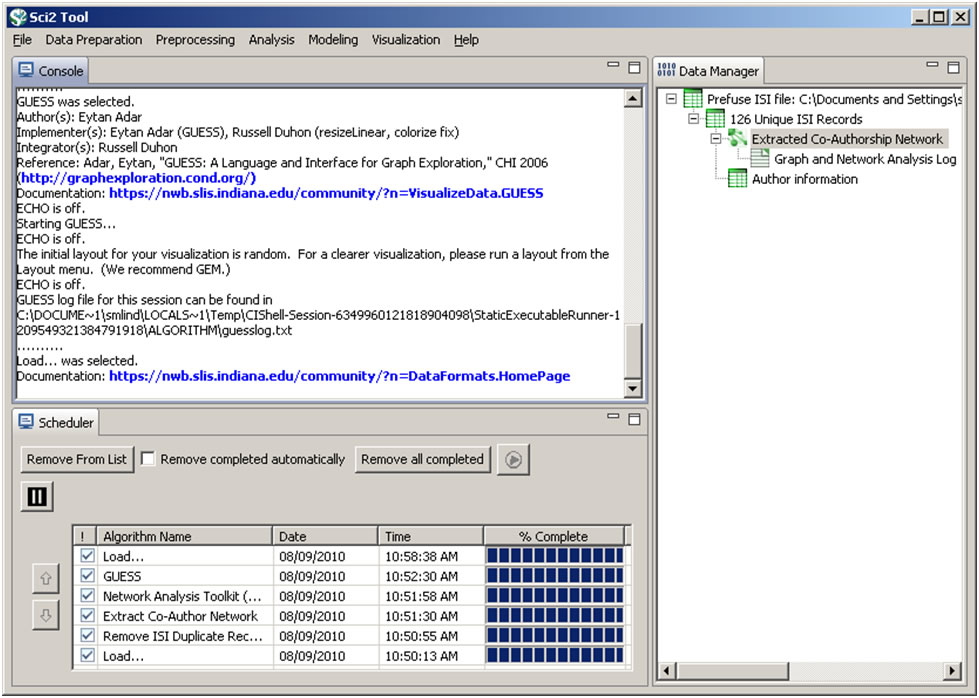
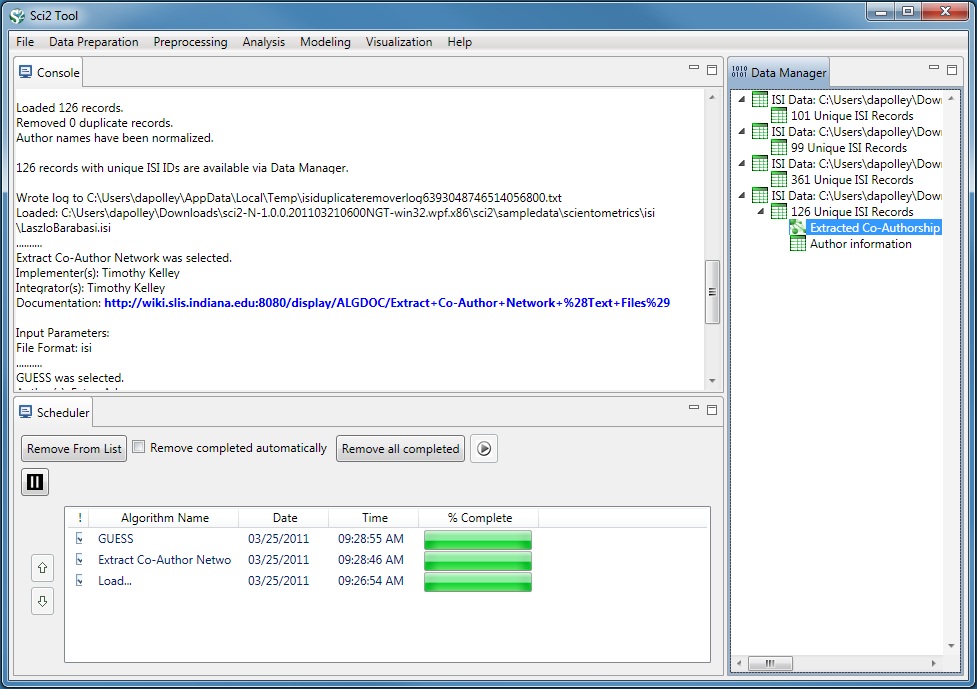
2.2.2 Console
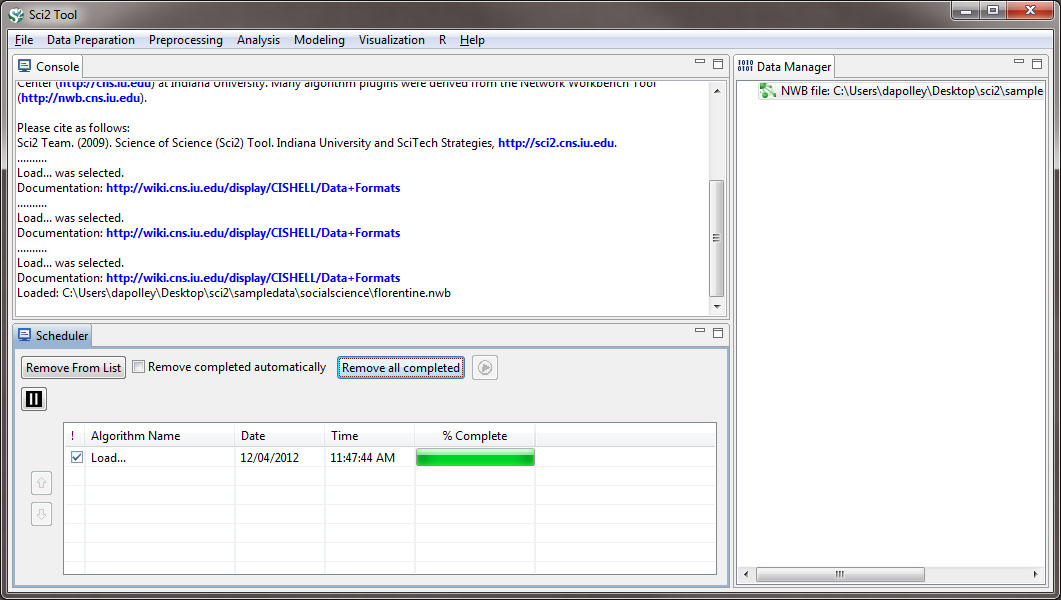
All operations such as loading, viewing, or saving datasets, running various algorithms, and algorithm parameters, etc. are logged sequentially in the 'Console' window as well as in log files stored in the 'yoursci2directory /logs' directory. The Console window also displays the acknowledgement information about the original authors of the algorithm, the developers, the integrators, a reference paper, and the URL to the reference if available, together with an URL to the algorithm description in the NWB/Sci2 community wiki.
The console log also indicates when an operation has failed to run (red text) or modified (orange text) its process because variation in the data file, typically variation within a data file's metadata.
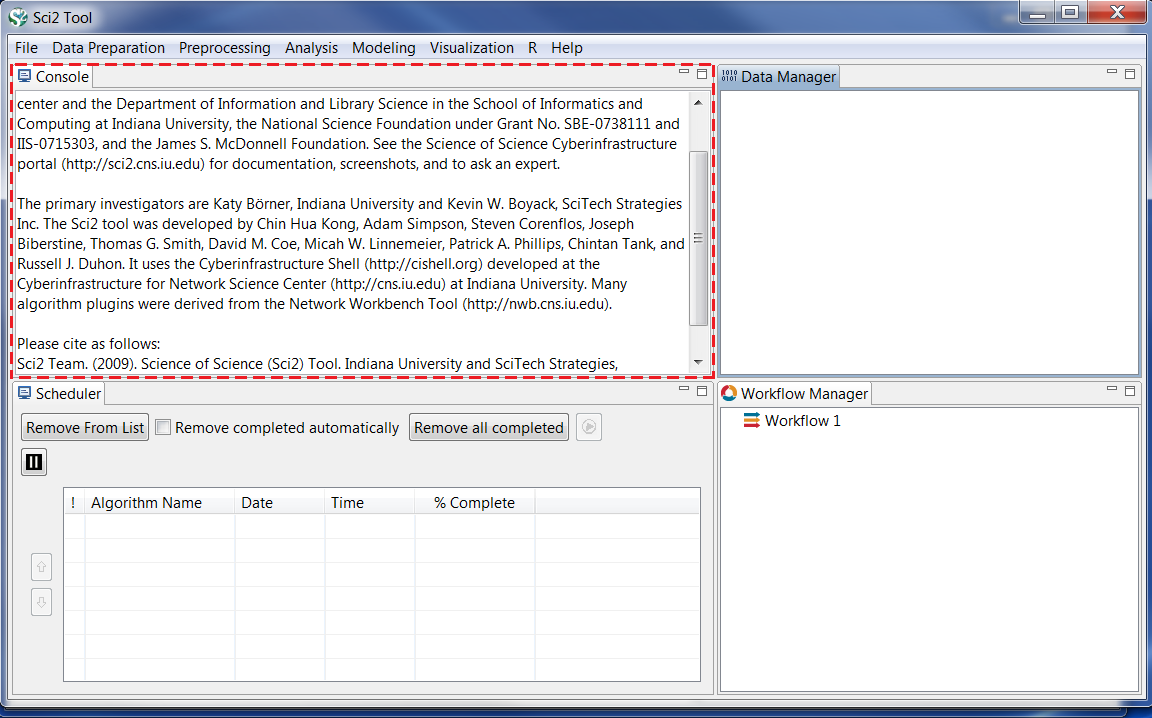
Figure 2.11: Sci2's Console and Schedule after successfully loading a database file
2.2.3 Data Manager
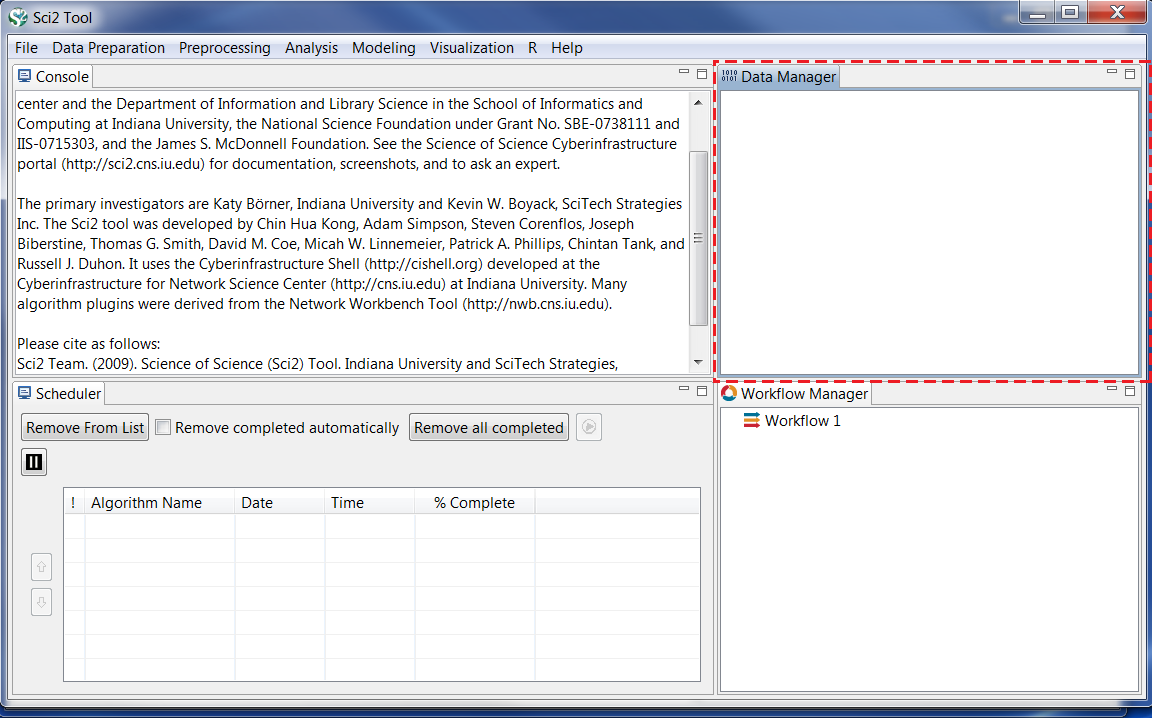
Figure 2.12: Sci2 Data Manager
The 'Data Manager' window displays all currently loaded and available datasets. The type of a loaded file is indicated by its icon:
![]() Text – text file
Text – text file
![]() Table – tabular data (csv file)
Table – tabular data (csv file)
![]() Matrix-data (Pajek .mat)
Matrix-data (Pajek .mat)
![]() Plot – plain text file that can be plotted using Gnuplot
Plot – plain text file that can be plotted using Gnuplot
![]() Network – Network data (in-memory graph/network object or network files saved as Graph/ML, XGMML, NWB, Pajek .net or Edge list format)
Network – Network data (in-memory graph/network object or network files saved as Graph/ML, XGMML, NWB, Pajek .net or Edge list format)
![]() Database – In-memory database
Database – In-memory database
![]() Tree – Tree data (TreeML)
Tree – Tree data (TreeML)
Derived datasets are indented under their parent datasets. That is, the children datasets are the results of applying certain algorithms to the parent dataset.
2.2.3.1 Manipulating Data Files within the Data Manager
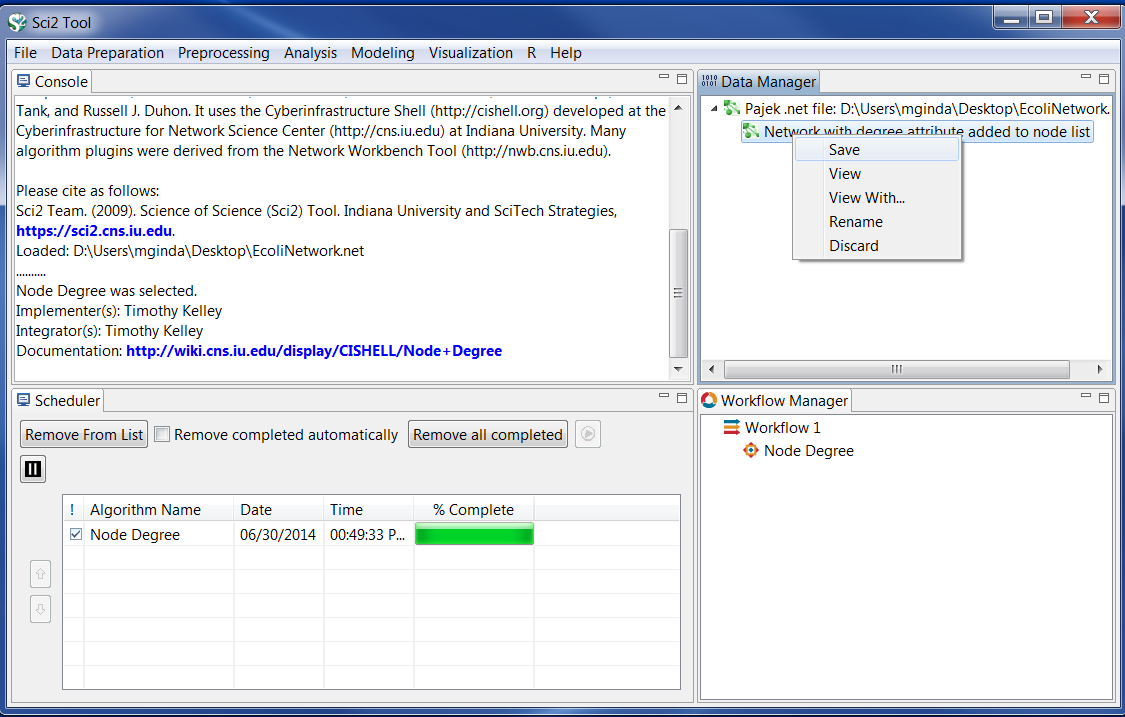
Figure 2.13: Right clicking a data file in Sci2's Data Manager to save, view, rename and discard files.
Within the data manager, a user may save, view data files or visualizations, rename and discard files. To perform these processes, a user should select the files that they want to work with, and then right-click and a small window will pop up.
The "View" and "View With..." options allow you data files, but in slightly different ways. The "View" option will automatically export a data file into either a text editor or spreadsheet editor on your computer. Whereas, the "View With..." option allows a user to select the program that they would prefer to export and view a data file in.
Beware that when a user selects "Discard," all data files and visualization files that are nested below the file selected to be discarded will also be discarded.
2.2.4 Scheduler

Figure 2.13: Sci2 Scheduler
The 'Scheduler' lets users keep track of the progress of running algorithms.
2.2.5 Workflow Manager
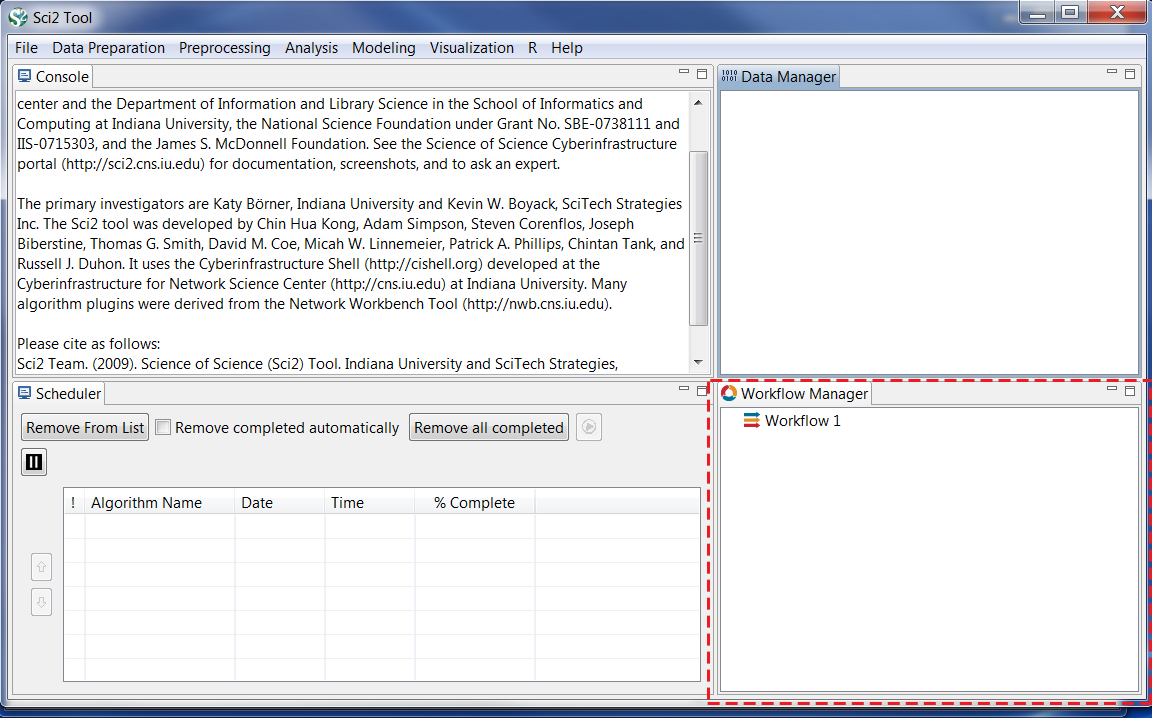
Figure 2.14: Sci2 Workflow Manager
Workflows within Sci2 allow users to document the steps taken in data preparation, analysis, processing, and visualization of a data set. Maintaining workflow documents allows a researcher to keep track of their analysis process, which is desirable for replication by other scientists and students and compare data analysis and outputs that use different parameters for the same algorithm.
The Sci2 Workflow Manager automatically creates an XML document that captures the sequence of algorithms that a user has implemented while using Sci2. Lines within a workflow are nested sequentially to indicate the order algorithms within Sci2 were run, as well as the parameters set by the user for an algorithm. Arrows to the left side of each line within the workflow can be opened to see or collapsed to hide steps or parameters that occur within the workflow.
Users may create new or load saved workflows into the Workflow Manager. User generated workflows may be edited, saved for later use. The run feature will allow users to replicate data analysis from all workflows. And the delete option allows for the removal of old workflows and unneeded processes from a workflow.
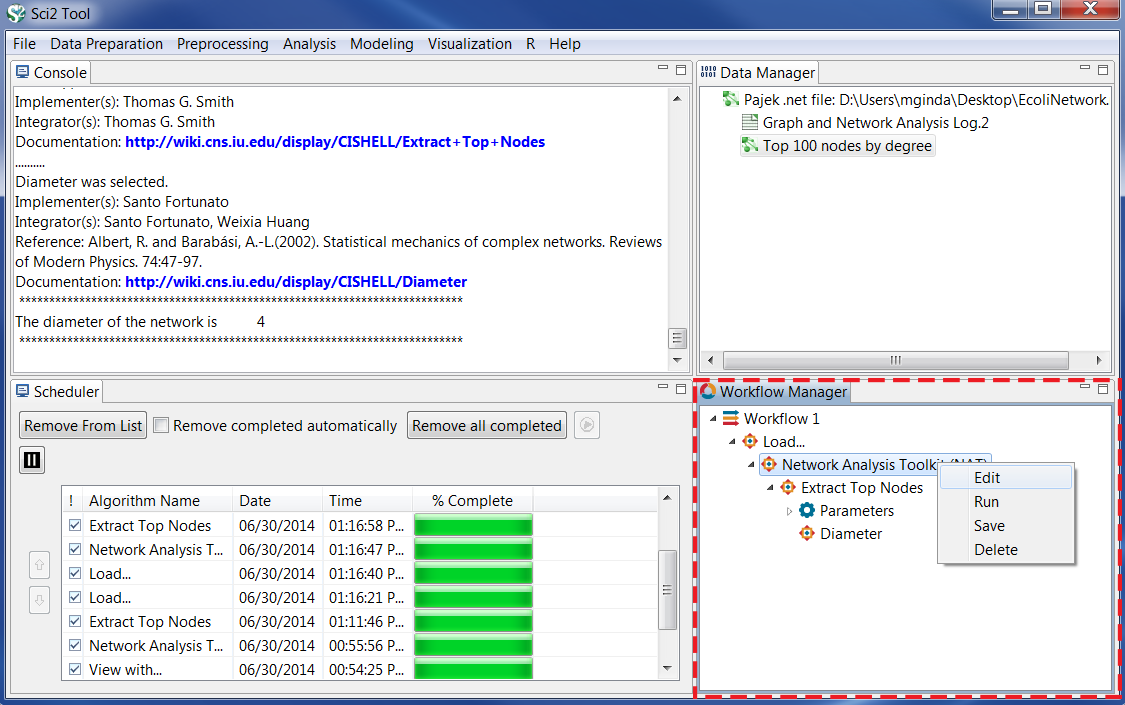
2.2.5.1 Modifying a workflow in the Workflow Manager

Figure 2.15: Modifying a workflow in the Sci2 Workflow Manager
To modify a workflow within the Workflow Manager, you need to select the workflow or task within the workflow that you want to modify, and then right click.
The "Edit" option allows you to rename a workflow or task by typing a new name in the highlighted text field. Renaming a workflow at the root level allows a user to differentiate between multiple workflows easily.
The "Save" option allows you to save a workflow to your Sci2 directory or file that you have chosen to save your data files. To save a workflow, you must first select the root in the workflow chain, and right click. Afterwards, a new window to your computer's file directory will open, allowing you choose the location and to name the workflow XML file being saved.
The "Delete" option allows a user to remove selected algorithms from workflows or workflows from the Workflow manager. Beware that when a user selects delete, all workflow process lines that are nested below the line selected to be discarded will also be discarded.
The "Run" option within the Workflow manager is still in development. To use, select the Workflow in the manager that you would like to re-run, right click and then select run. When you 'run'
Selecting run should allow users the ability to batch process data files within Sci2 for repeatable processing, analysis, and visualization; however, any problems that exist within the data files (data quality, metadata quality, formatting) or parameters set within the old workflow will cause the process to fail.
2.2.5.2 Creating and loading workflows in the Workflow Manager
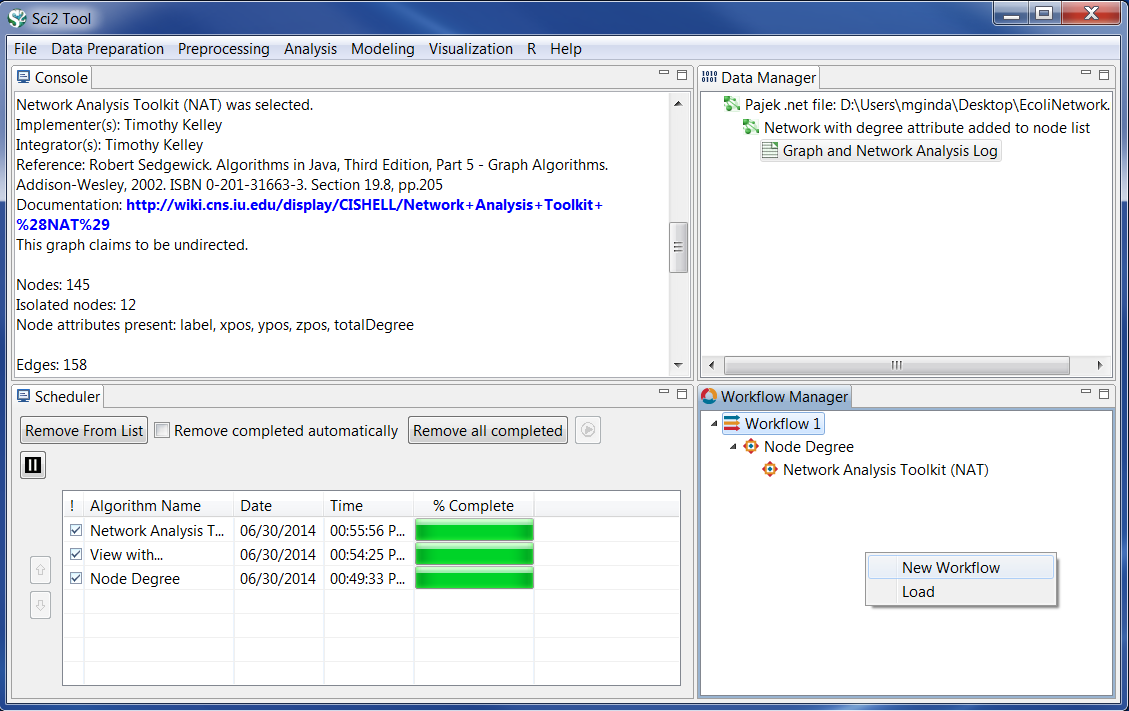
Figure 2.16: Creating and loading a workflow in the Workflow Manager
To load or create a new workflow within the manager, a user needs to right click with their mouse within the Workflow Manager window. Doing so will present a menu box that provides a user with two options: New Workflow and Load.
Selecting 'Load' within this menu will open a pop-up window to the Sci2 directory, which you can use to navigate to the file where you have saved a previous workflow XML file.
Selecting 'New Workflow' will cause Sci2 to generate a new root workflow line in the workflow manager (see Figure 2.17). Once a new workflow has been created, all new operations will begin to appear in the new workflow, even if an operation was apart of a workflow for an older workflow for data file.
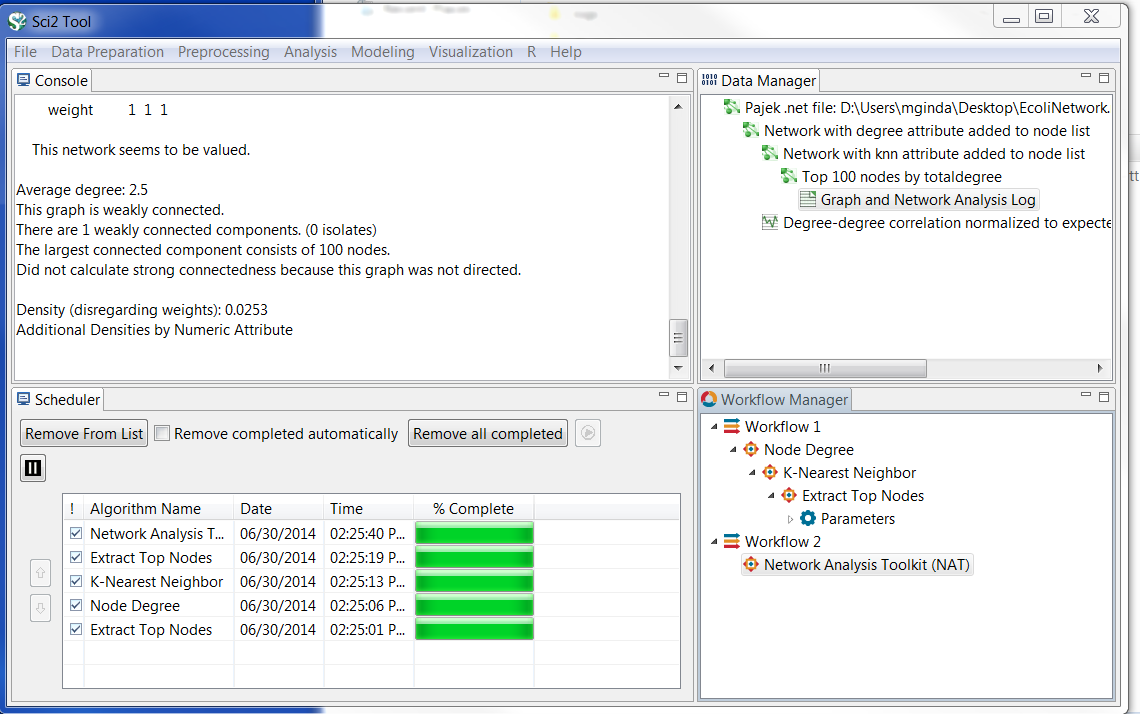
Figure 2.17: After creating a new workflow in the Workflow Manager, all new operations to data files will be loaded into the new workflow.