Color Specification
About The Color Selection Process
Color selection based on work by Martin Krzywinski (http://mkweb.bcgsc.ca) and Cynthia Brewer (http://colorbrewer2.org).
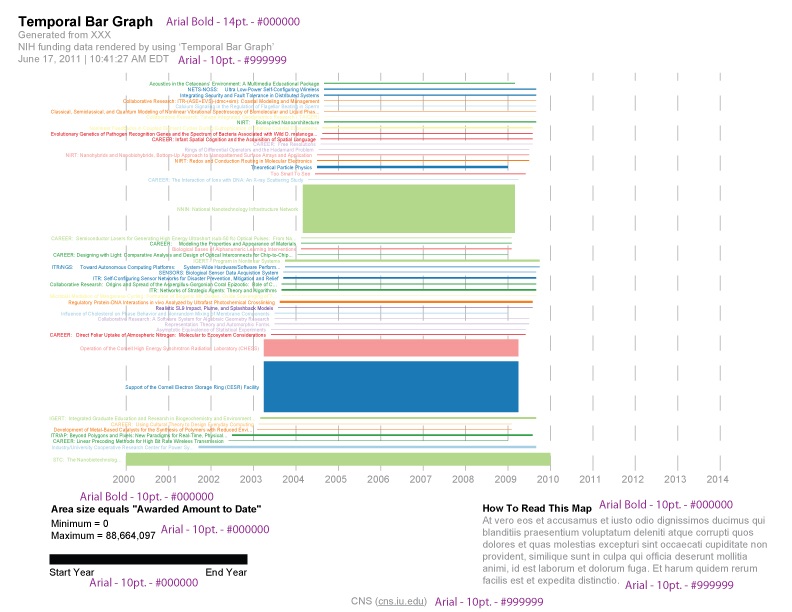
Temporal Bar Graph
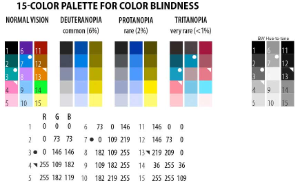
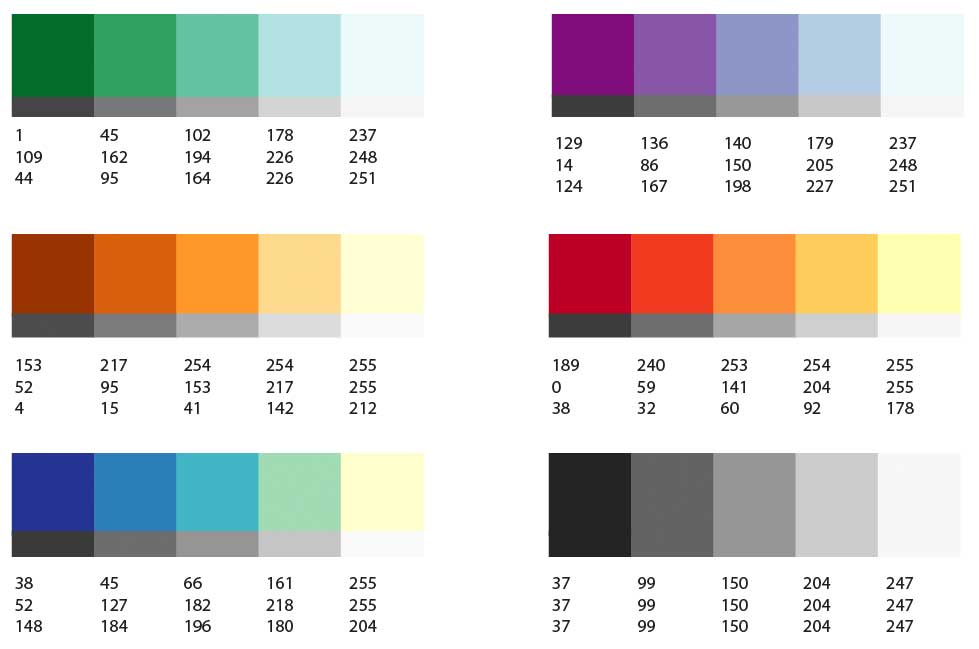
Starting off with an example of a 15-color palette that is safe for color blindness (below).
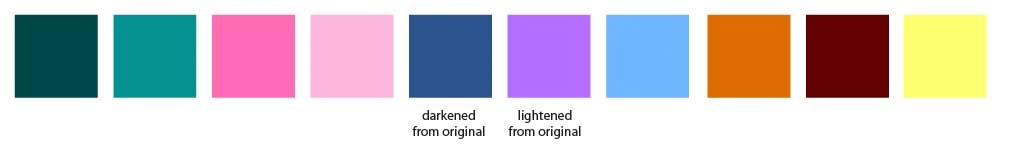
Eliminating 5 of the colors that are either too dark or too light, we get our 10-color palette for the Temporal Bar Graph.
We convert these colors to greyscale to check if there is enough contrast between shades for people that are visually challenged. 
Next, we place them side by side and then arrange them from dark to light.
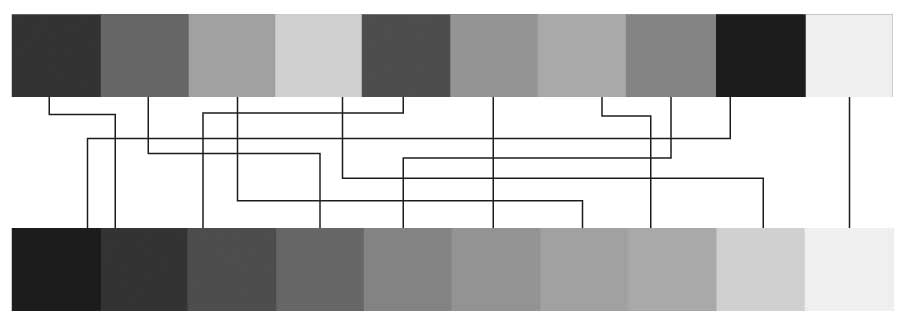
For comparison, here's a line of swatches using only variations of black and reduced by 10% in each successive swatch. 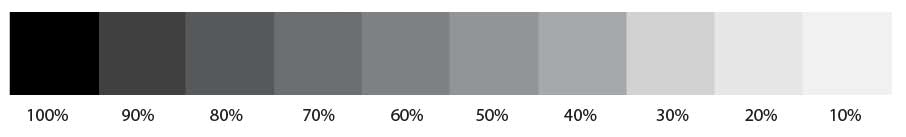
Based off of the image above, it looks like we're doing well with the original color values in the first image. Below are the swatches and RGB values for the swatches and for use in the Temporal Bar Graph.

Bipartite Network Colors

Geographical Map Colors
These are taken directly from Katy's ColorBlender examples from email
Map of Science Colors
See: http://sci.cns.iu.edu/standards.html

Original Map of Science Colors
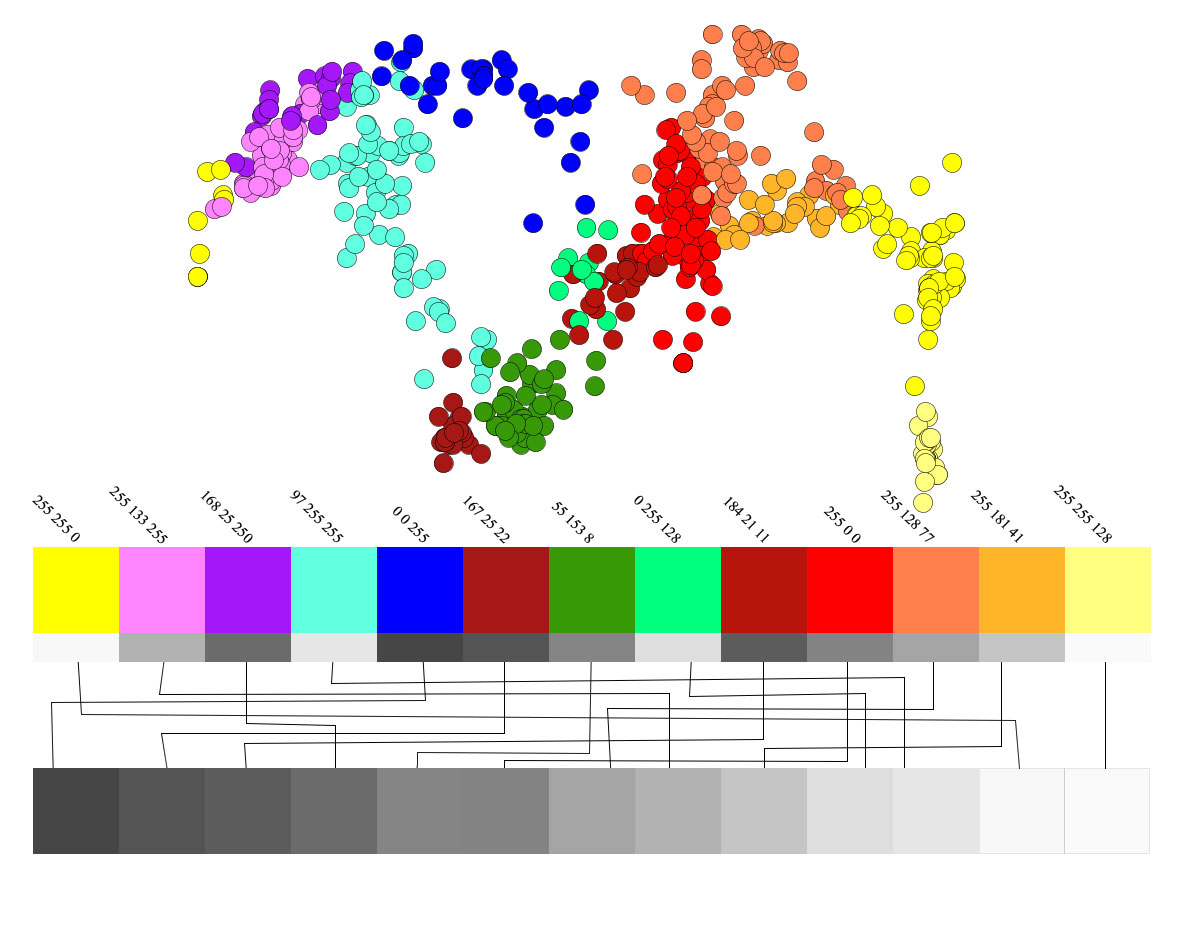
P100 Comparisons

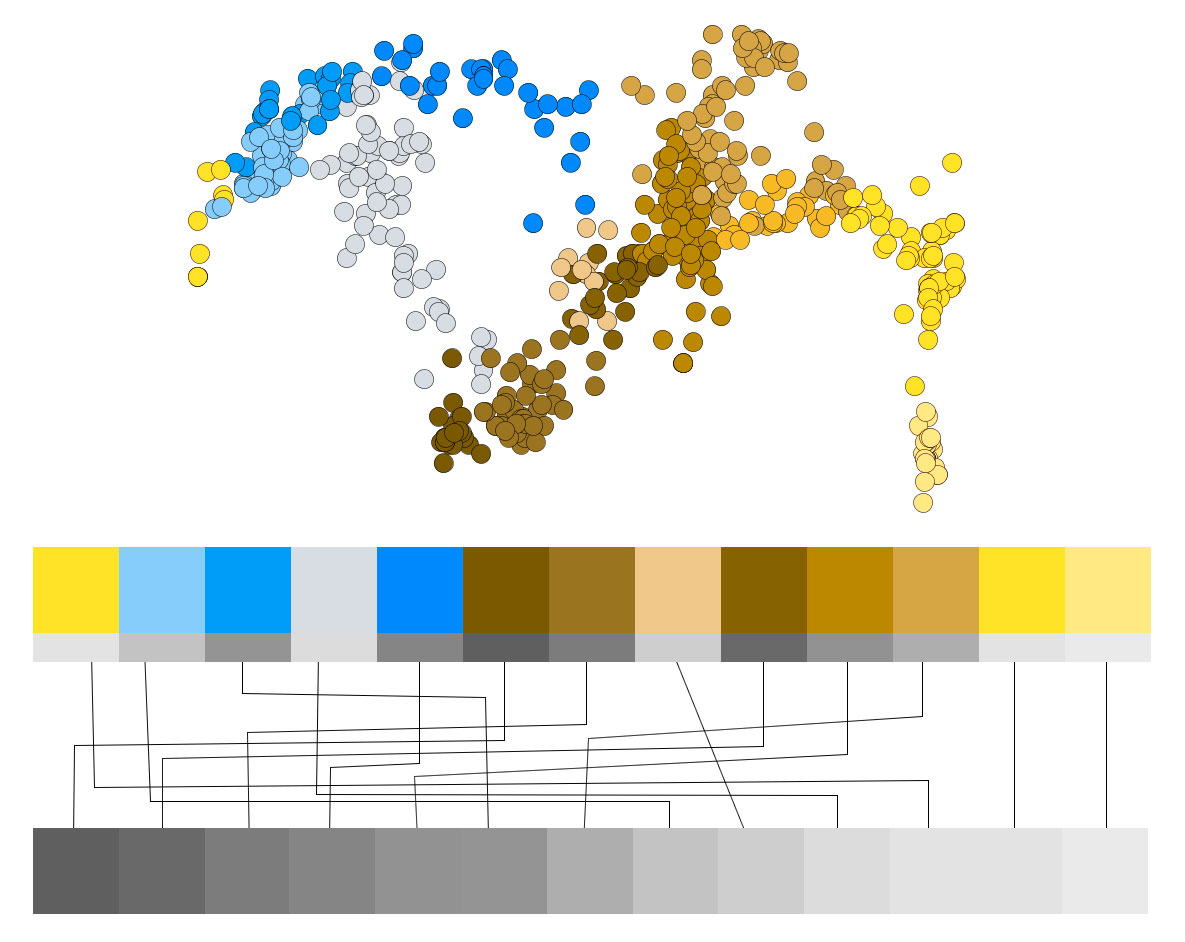
D100 Comparisons
Fonts Specification
Please see the following image for information regarding fonts and sizes used on visualizations.