This example will demonstrate how to visualize data using Sci2. We will begin with a very brief introduction to networks because in this example we will be visualizing a network file from the sample data provided with the Sci2 download. After the introduction to networks we will walk you through a basic visualization workflow using Sci2, in which we will demonstrate how to visualize the sample data. The format will be the same used in section 5 Sample Workflows, we will start with a basic overview of the data we will be using and the cover the steps from loading the data to creating the resulting visualization.
| File Name | florentine.nwb |
|---|---|
| Time Frame | Early 15th century |
| Region(s) | Italy |
| Topical Area(s) | History, Politics |
| Analysis Type(s) | Network |
In this workflow we will be working with Padgett's Florentine families dataset which includes 16 different Italian families from the early 15th century. Each family is represented by a node in the network and families are connected by edges that represent either a marriage or business/lending ties. Each node (family) has several attributes: wealth (in thousands of lira), number of priorates (seats on the civic council), and totalities (total number of business ties and marriages in the dataset).
Loading the Data in Sci2
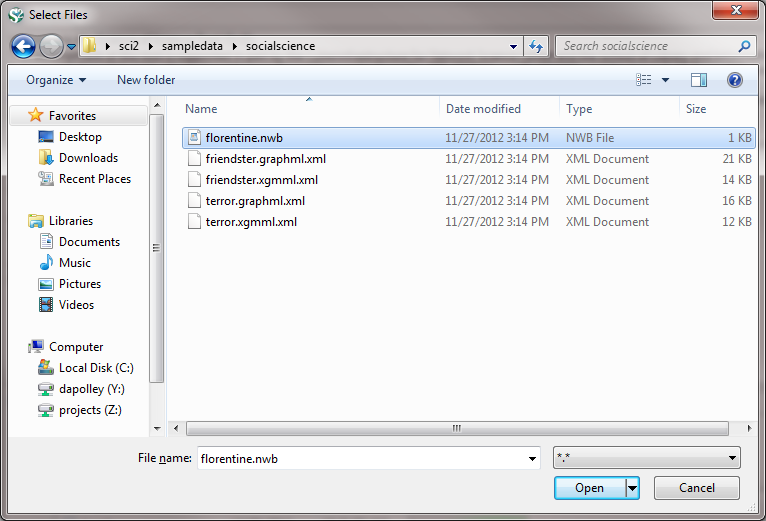
First, load the florentine.nwb by following 'File > Load > yoursci2directory/sampledata/socialscience/florentine.nwb' :
Once you have loaded the data in Sci2, it will appear in the Data Manager:

Visualize the Data
For this workflow we will skip straight to the visualization step, since the network file that we loaded already has the attributes we are interested in visualizing (wealth, priorates, and totalities). For other datasets, you will likely need to extract networks and run some type of analysis to answer the questions you are interested in. Examples or more detailed analysis and visualizations will be covered in 5 Sample Workflows.
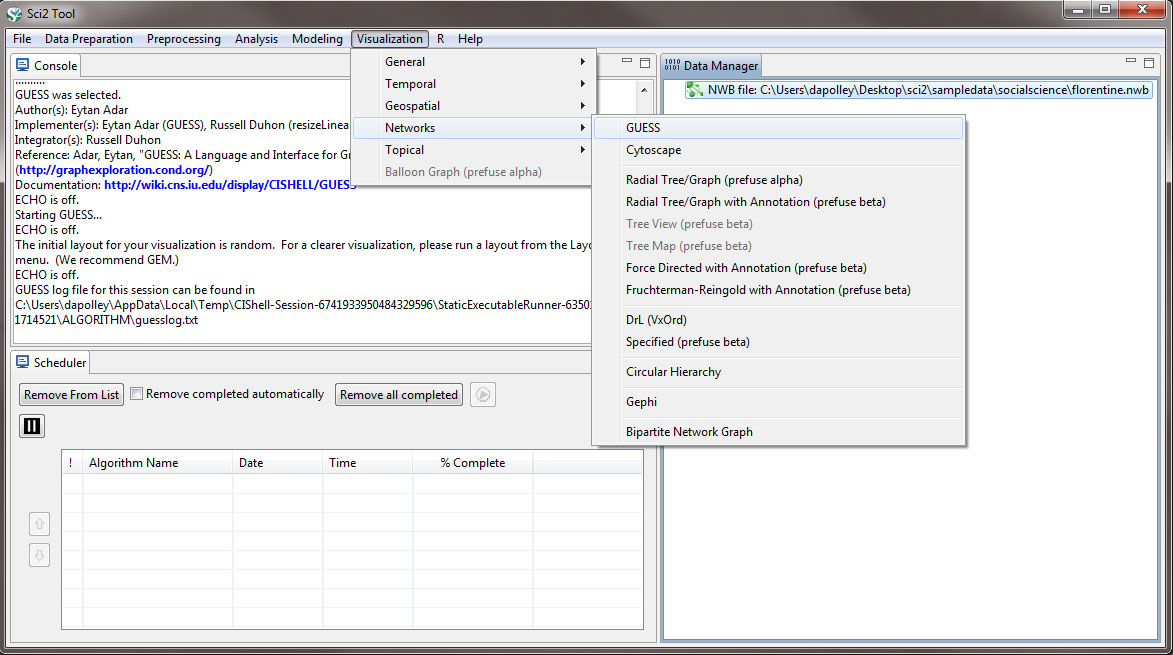
To visualize this network select the file from the Data Manager and run 'Visualization > Networks > GUESS'
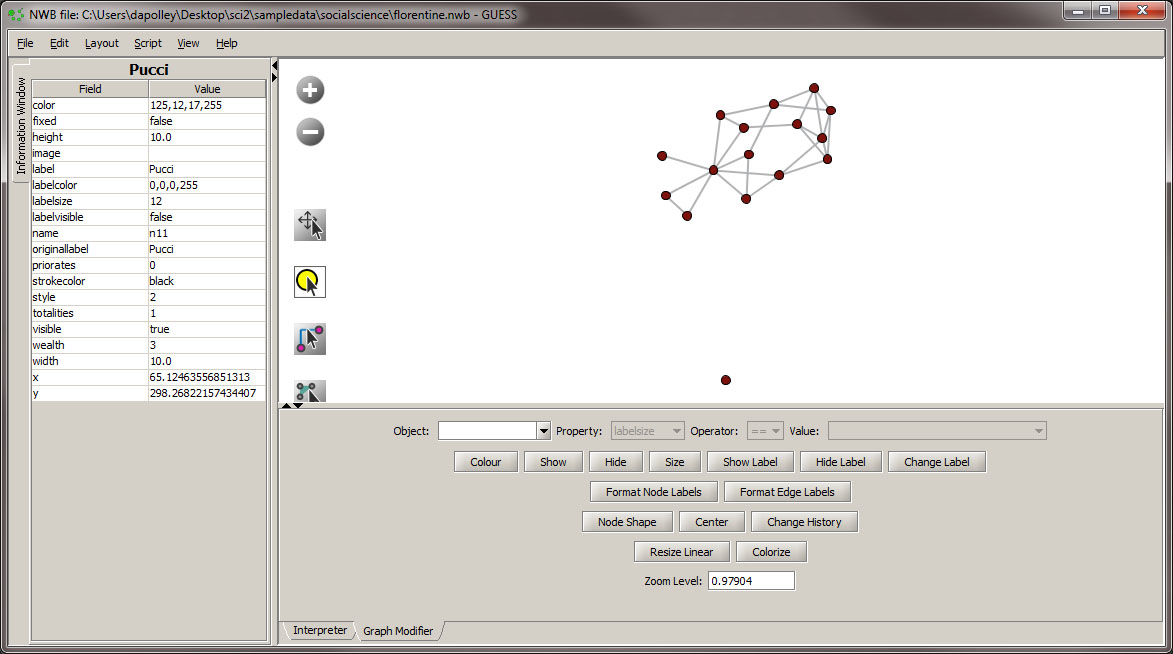
When the network is loaded in GUESS it will be laid out randomly:

The first step in enhancing this network visualization is to apply a different layout. For this visualization we will use the GEM layout 'Layout > GEM' You will notice that the GEM layout is random, you can run it multiple times and the network will appear slightly different each time:

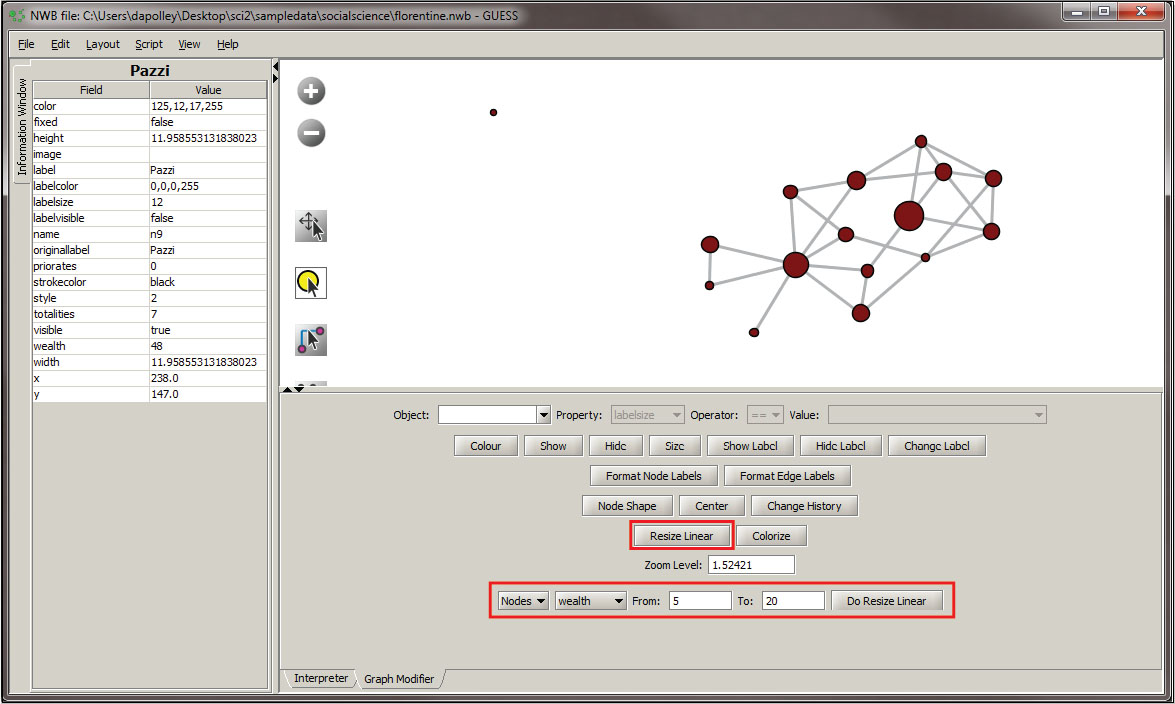
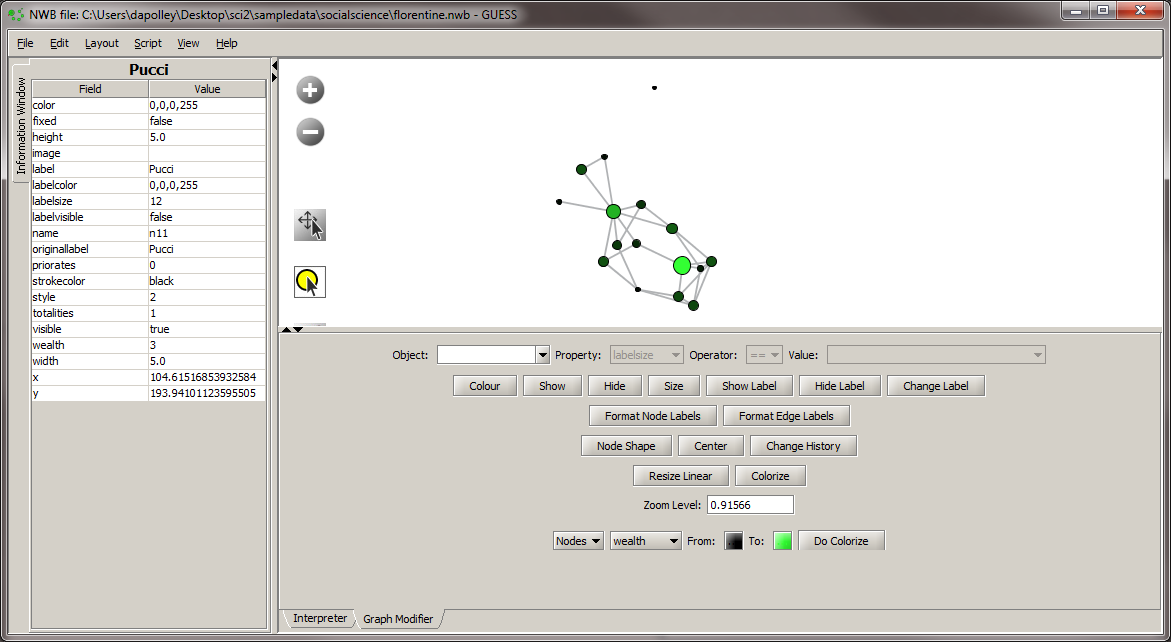
The next step will be to resize the nodes based on the wealth attribute. To do this resize select the "Resize Linear" button and set the parameters to those shown below:
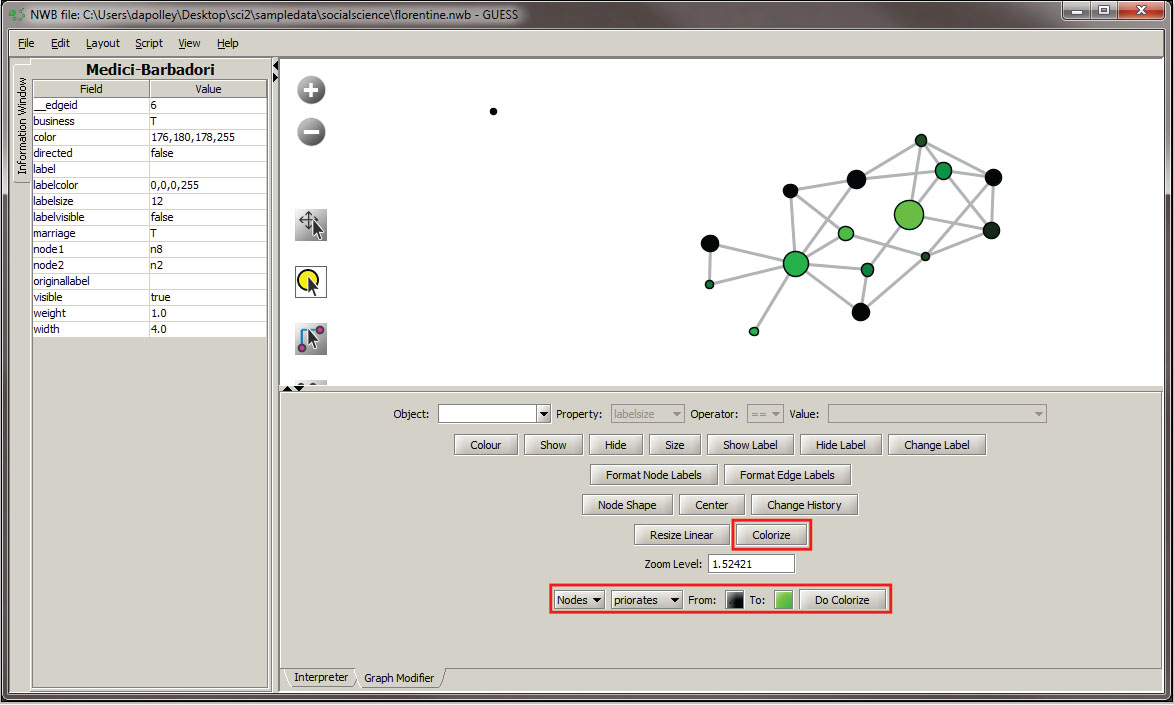
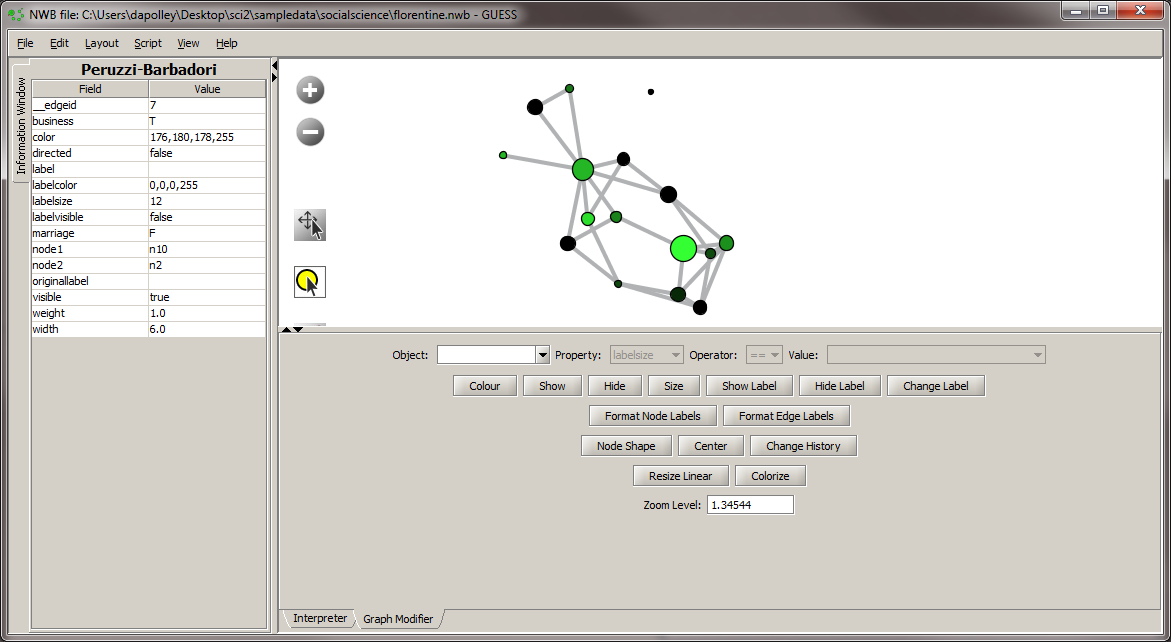
Next we will colorize the nodes based on priorates to add an additional dimension to this visualization:
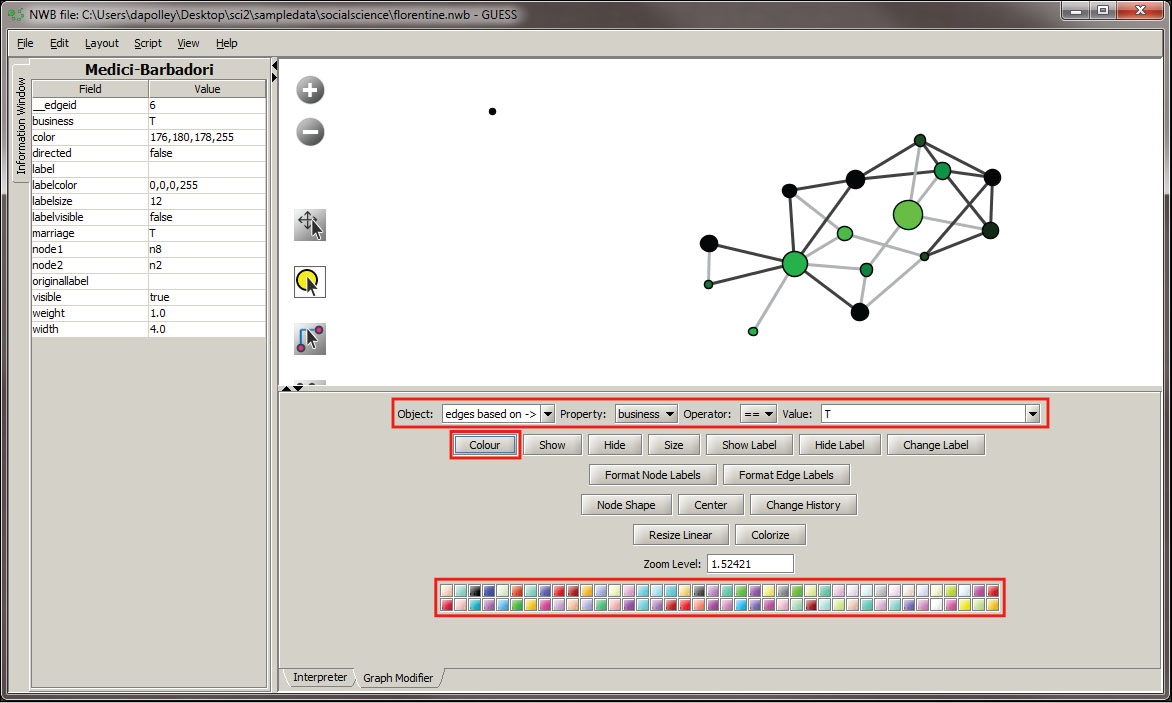
Next we will color the edges to show the type of relationship between the families. To do this, you will need to select the "Object" edges based on ->, set the property to "marriage", the operator to "==", and the value to "T". Next, click the "Colour" button and you can select the color of your choice from the pallet that will appear at the bottom of the Graph Modifier pane.

You can repeat this process for the "business" property if you want to, or you can leave the edges that represent business ties the default color. In this workflow we will leave them the default color, light gray.The final step is to show all the labels. To do this, you will need to select the "Object" all nodes and the click the "Show Label" button and the labels will appear in the visualization:

We just need to do two more things to make the network look more presentable. First, we need to adjust some of the spacing between the nodes so that the labels we just added are more visible. You can do this one of two ways: rerun the GEM layout or you can adjust individual nodes manually by using the icon in the graph window and clicking on nodes and dragging them around:

Since the GEM layout is random and all the nodes are spaced more or less evenly apart, you do not have to worry about disrupting the layout. However, other layout algorithms may space the nodes according to specific attributes of the network. Manually moving around nodes in this case would disrupt the layout of the network and distort the meaning of the visualization.
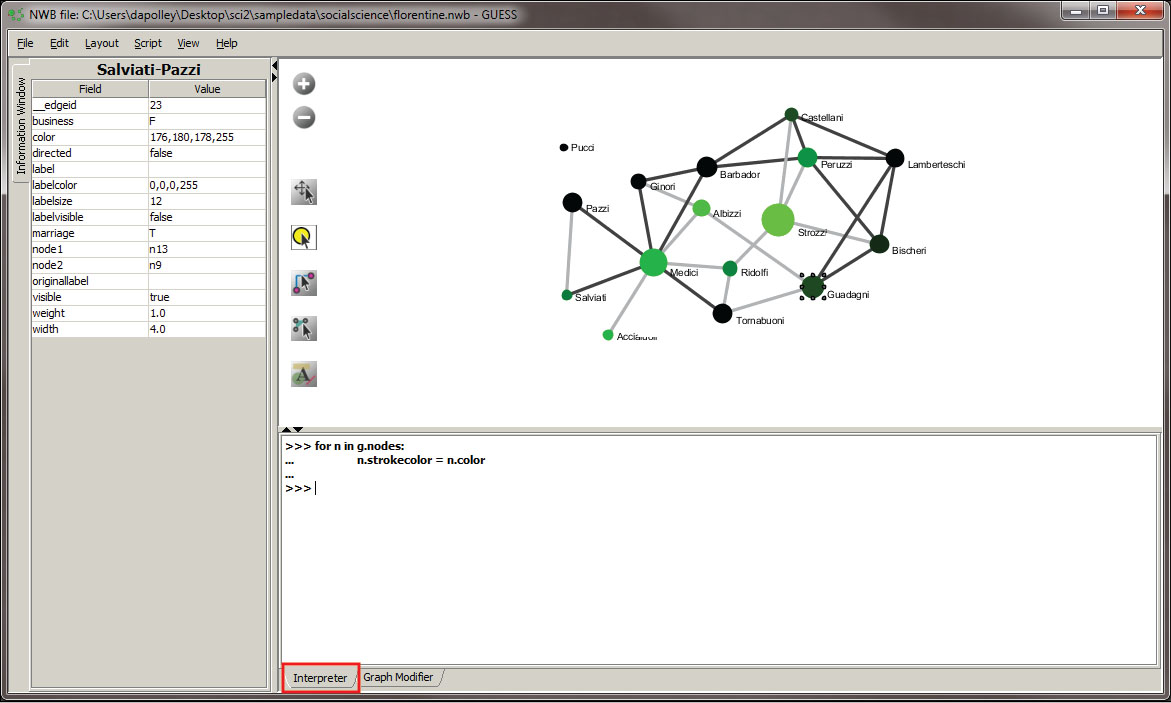
The last thing we want to do to our network is color the border of the nodes the same as the nodes themselves. This is not as crucial for networks with only a few nodes, but as the size of your network increases it can become difficult to read with the thick black lines around every node. To color those the same as the node go to the Interpreter tab at the bottom of the GUESS window and type in the following commands:
for n in g.nodes:
	n.strokecolor = n.color
This code basically tells GUESS that for every node (n) in this graph of nodes (g.nodes) make the border color of the nodes (n.strokecolor) equal to the node color (n.color). After you type the first line you will need to hit the "Tab" key before you start typing the second line of code. In the Interpreter this looks like this:
The final visualization will look something like this:

Now you can roughly determine the influence of the families based on the size and color (wealth and priorates) of the nodes. You can also determine the type of relationship between the families. The next step is learning how to export your image and create a legend to help readers decipher what is being represented. To learn how to create your own legends see our documentation on 2.4 Saving Visualizations for Publication. If you would like to learn more visualization workflows and various network extractions from raw data, see 5 Sample Workflows.