Cornell.nsf Indiana.nsf Michigan.nsf |
|
Time frame: | 2000-2009 |
Region(s): | Cornell University, Indiana University, Michigan University |
Topical Area(s): | Miscellaneous |
Analysis Type(s): | Co-PI Network |
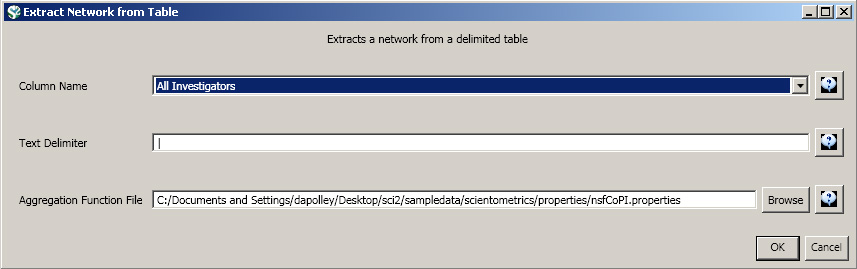
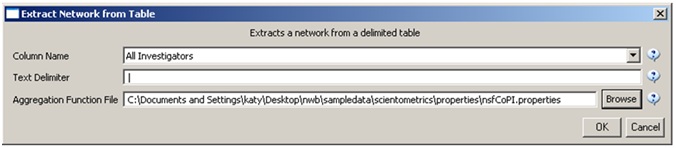
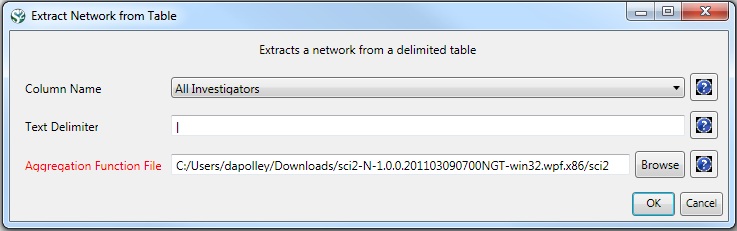
Load 'Cornell.nsf', 'Michigan.nsf', and 'Indiana.nsf' using 'File > Load" and following this path: 'yoursci2directory/sampledata/scientometrics/nsf' (if these files are not in the sample data directory they can be downloaded from 2.5 Sample Datasets). Use the following workflow for each of the three nsf files loaded. Select each of the datasets in the Data Manager window and run 'Data Preparation > Extract Co-Occurrence Network' using the following parameters (Note that the Aggregation Function File is 'yoursci2directory/sampledata/scientometrics/properties/nsfCoPI.properties'):
Aggregate Function File
Make sure to use the aggregate function file indicated in the image below. Aggregate function files can be found in sci2/sampledata/scientometrics/properties.
About NSF text delimiters:
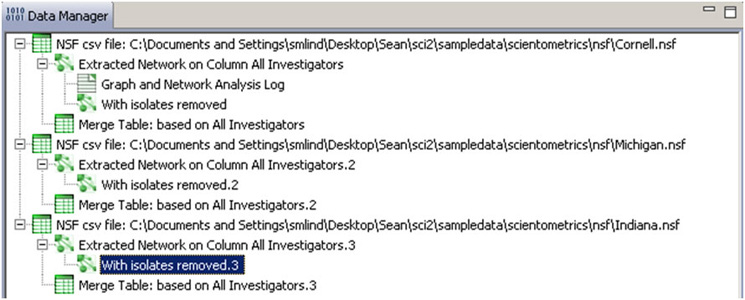
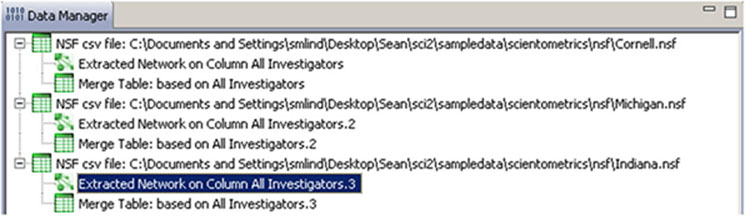
Two derived files per dataset will appear in the Data Manager window: the co-PI network and a merge table.
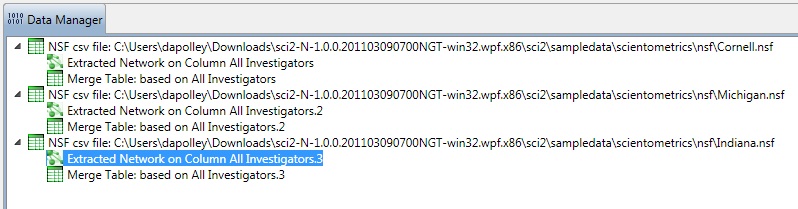
In the network, nodes represent investigators and edges denote their co-PI relationships. (To learn how the merge table can be used to further clean PI names, see section 5.1.4.2 Author Co-Occurrence (Bibliographic Coupling) Network.)
Choose the "Extracted Network on Column All Investigators" and run 'Analysis > Networks > Network Analysis Toolkit (NAT)' for each dataset. This will display the amount of nodes and edges, as well as the amount of isolate nodes that can be removed by running 'Preprocessing > Networks > Delete Isolates'.
Select 'Visualization > Networks > GUESS' and run 'Layout > GEM' followed by 'Layout > Bin Pack' to visualize the network. Run the 'yoursci2directory/scripts/GUESS/co-PI-nw.py' script. Visualizations of the three university's co-PI networks are shown in Figure 5.23.
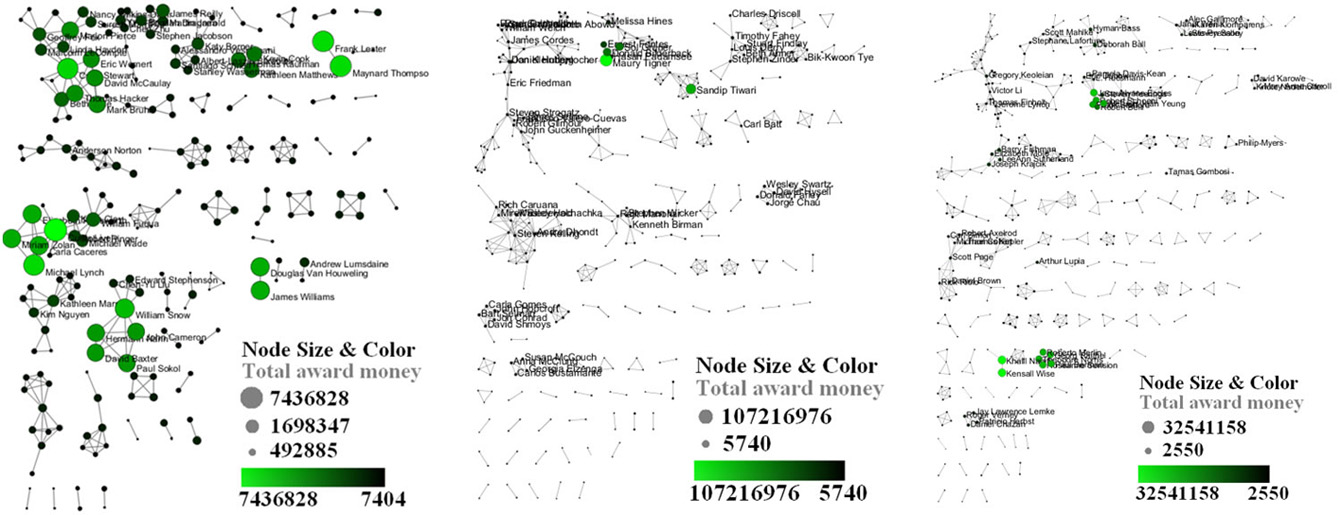
Figure 5.23: Co-PI network of Indiana University (top, left), Cornell University (top, right), University of Michigan (middle).
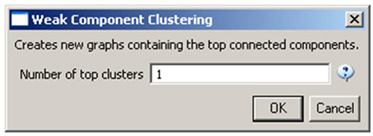
To see a more detailed view of any of the components in the network (e.g. the largest Indiana component) select the network with deleted isolates in the Data Manager:
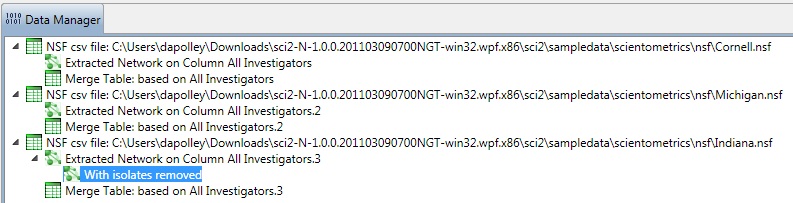
Then, run 'Analysis > Networks > Unweighted & Undirected > Weak Component Clustering' with the parameter:
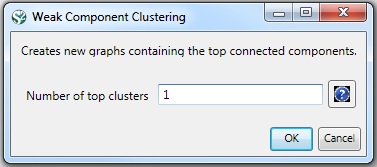
Indiana's largest component has 19 nodes, Cornell's has 67 nodes, and Michigan's has 55 nodes. Visualize Indiana's network in GUESS using the 'yoursci2directory/scripts/GUESS/co-PI-nw.py' script. Save the file as a jpg by selecting 'File > Export Image'. Use the "Browse..." option in the "Export Image – GUESS" popup window to select the folder in which you would like to save the image.
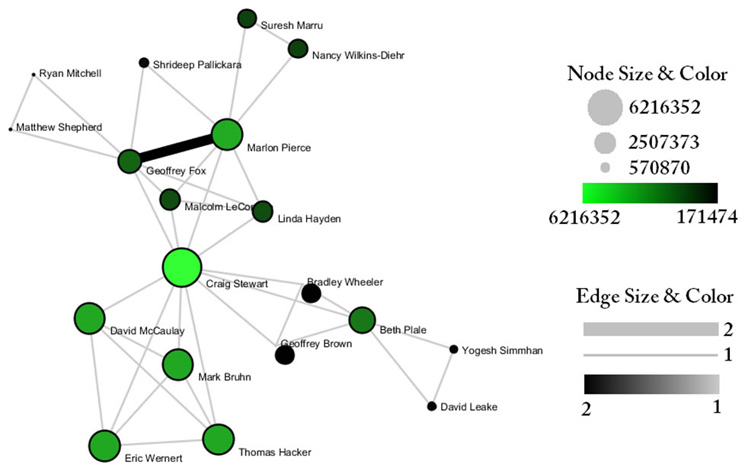
Figure 5.24: Largest component of Indiana University co-PI network. Node size and color display the total award amount.
To see the log file from this workflow save the 5.2.1 Funding Profiles of Three Universities (NSF Data) file.
5.2.1.1 Database Extractions
The database plugin is not currently available for the most recent version of Sci2 (v1.0 aplpha). However, the plugin that allows files to be loaded as databases is available for Sci2 v0.5.2 alpha or older. Please check the Sci2 news page (https://sci2.cns.iu.edu/user/news.php). We will update this page when a database plugin becomes available for the latest version of the tool.
The Sci2 Tool supports the creation of databases for NSF files. Database loading improves the speed and functionality of data preparation and preprocessing. To load the Indiana NSF file as a database, go to 'File > Load > and select yoursci2directory/sampledata/scientometrics/nsf/Indiana.nsf.' In the "Load" pop-up window, choose "NSF database." Cleaning should be performed before any other task using 'Data Preparation > Database > NSF > Merge Identical NSF People'.
To view a breakdown of each investigator from Indiana, run 'Data Preparation > Database > NSF > Extract Investigators'. View the table – notice that next to each investigator will be listed their total number of awards, total as the PI and as a Co-PI, the total amount awarded to date, as well as their earliest award start date and latest award expiration date.
To create Co-PI networks like those from the previous workflows, simply run 'Data Preparation > Databases > NSF > Extract Co-PI Network' on the cleaned database. Delete the isolates by running 'Preprocessing > Networks > Delete Isolates'.
As before, to visualize the network, select 'Visualization > Networks > GUESS' and run 'Layout > GEM' followed by 'Layout > Bin Pack'. Run the 'yoursci2directory/scripts/GUESS/co-PI-nw_database.py' script to apply the standard Co-PI network theme.
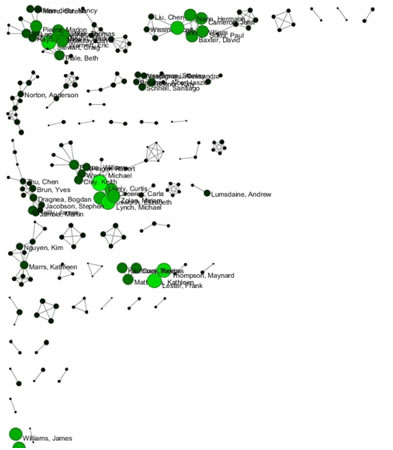
Figure 5.25: Indiana University Co-PI network using databases.