5.2.4.1 Document Co-Citation
Scientometrics.isi |
|
Time frame: | 1978-2008 |
Region(s): | Miscellaneous |
Topical Area(s): | Scientometrics |
Analysis Type(s): | Document Co-Citation Network |
Scientometrics is a discipline which uses statistical and computational techniques in order to understand the structure and dynamics of science. Here we use ISI data from the journal "Scientometrics" and Science of Science and Innovation Policy (SciSIP) data from NSF Awards Search.
Download Scientometrics.isi. Load the file using 'File > Load' and locating the downloaded file. This domain level dataset is ideal for document co-citation analysis, as the scale is large enough that the resulting network will paint a fairly accurate picture of document similarity within the domain of scientometrics.
New ISI File Format
Web of Science made a change to their output format in September, 2011. Older versions of Sci2 tool (older than v0.5.2 alpha) may refuse to load these new files, with an error like "Invalid ISI format file selected."
Sci2 solution
If you are using an older version of the Sci2 tool, you can download the WOS-plugins.zip file and unzip the JAR files into your sci2/plugins/ directory. Restart Sci2 to activate the fixes. You can now load the downloaded ISI files into the Sci2 without any additional step. If you are using the old Sci2 tool you will need to follow the guidelines below before you can load the new WOS format file into the tool.
You can fix this problem for individual files by opening them in Notepad (or your favorite text editor). The file will start with the words:
Original file:
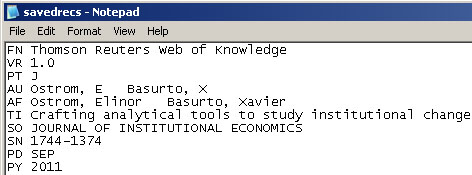
Just add the word ISI.
Updated file:

And then Save the file.
The ISI file should now load properly. More information on the ISI file format is available here (http://wiki.cns.iu.edu/display/CISHELL/ISI+%28*.isi%29).
Select the dataset "2126 Unique ISI Records" in the Data Manager window and run 'Data Preparation > Extract Paper Citation Network'.
Two files will appear in the Data Manager window: the paper-citation network and the paper information table.
Select the "Extracted paper-citation network" and run 'Preprocessing > Networks > Extract Nodes Above or Below Value' with the following parameters:
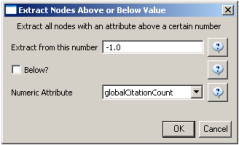
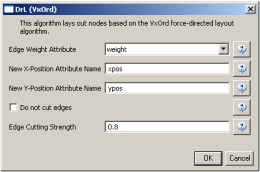
The produced network contains only the original ISI records. Select the resulting file and run 'Data Preparation > Extract Document Co-Citation Network'. Then, select the network and run 'Analysis > Networks > Network Analysis Toolkit (NAT)'. There are 2056 nodes, 26070 edges and 775 isolates in the network. Run 'Preprocessing > Networks > Delete Isolates' to remove all the isolates. Because this network is too dense to lay out in GUESS, run 'Visualization > DrL (VxOrd)' with the parameters:
Next, select "Laid out with DrL" in the Data Manager and run 'Visualization > Network > GUESS'. Run the following commands in the GUESS "Interpreter":
     >for n in g.nodes:
         if n.xpos is not None and n.ypos is not None:
             n.x = n.xpos * 10
             n.y = n.ypos * 10
     >resizeLinear(localcitationcount,1,50)
     >colorize(localcitationcount, gray, black)
     >resizeLinear(weight, .25, 8)
     >colorize(weight, "127,193,65,255", black)
Go to "Graph Modifier" and choose 'Object: nodes based on -> > Property: localcitationcount > Operators: >= > Value: 20 > Show Label'. See Figure 5.21.
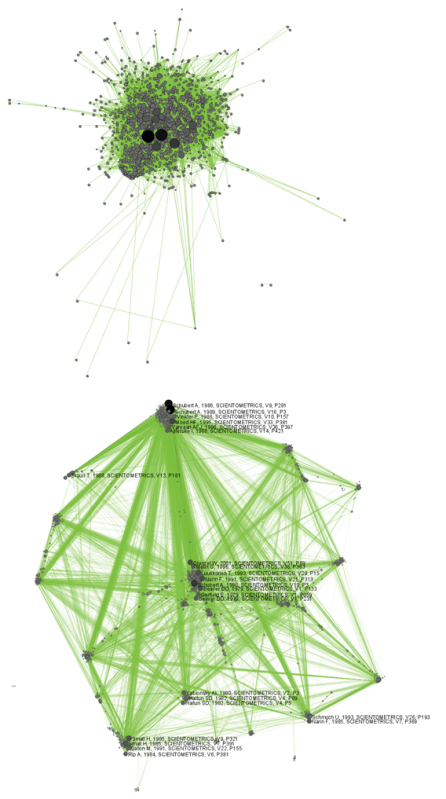
Figure 5.30: Document co-citation network for Scientometric.isi in GUESS without DrL edge cutting (top) and with DrL (VxOrd) (bottom).
To see the log file from this workflow save the 5.2.4.1 Document Co-Citation log file.
5.2.4.2 Geographic Visualization
Scientometrics.isi |
|
Time frame: | 1978-2008 |
Region(s): | Miscellaneous |
Topical Area(s): | Scientometrics |
Analysis Type(s): | Geospatial Analysis |
Using the dataset loaded from section 5.2.4.1, select '2126 Unique ISI Records' in the Data Manager. To find the latitude and longitudes of the locations of researches publishing in Scientometrics, run Analysis > Geospatial > Yahoo! Geocoder. Note that you will need a Yahoo Application ID in order to run this query. Enter your Yahoo Application ID (sign up for one here), "Address" for the Place Type, and the "Reprint Address" for the Place Column Name. Press 'OK'. This step may take several minutes to complete.

A new table will appear in the Data Manager labeled 'With Latitude & Longitude from 'Reprint Address'' containing all data from the initial table, plus columns with the Yahoo Geocoded Latitude and Longitude Coordinates. Select this file and run Visualization > Geospatial > Proportional Symbol Map using the parameters listed below.
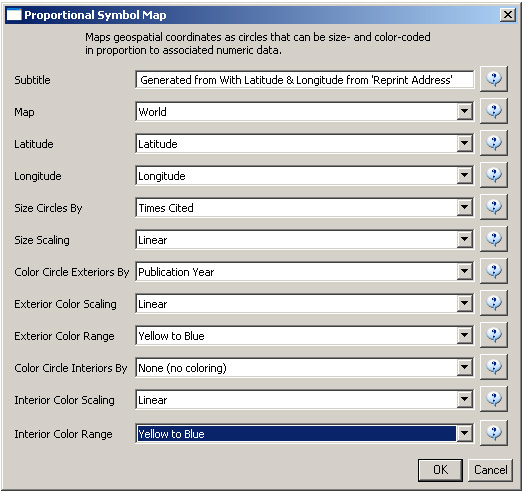
Save and view the resulting visualization using the directions described at 2.4 Saving Visualizations for Publication. This will be the result:
Figure 5.31: Scientometrics.isi geospatial visualization. Circle sizes represent times cited, colors represent publication year.