RNAi |
|
Time frame: | 1865-2008 |
Region(s): | Miscellaneous |
Topical Area(s): | RNAi |
Analysis Type(s): | Co-Author Network, Patent-Citation Network, Burst Detection |
The database plugin is not currently available for the most recent version of Sci2 (v1.0 aplpha). However, the plugin that allows files to be loaded as databases is available for Sci2 v0.5.2 alpha or older. Please check the Sci2 news page (https://sci2.cns.iu.edu/user/news.php). We will update this page when a database plugin becomes available for the latest version of the tool.
The data for this analysis comes from a search of the Scholarly Database (SDB) (http://sdb.cns.iu.edu/) for "RNAi" in "All Text" from Medline, NSF, NIH and USPTO. A copy of this data is available in 'yoursci2directory/sampledata/scientometrics/sdb/RNAi' (if the file is not in the sample data directory it can be downloaded from 2.5 Sample Datasets). The default export format is .csv, which can be loaded directly into the Sci2 Tool.
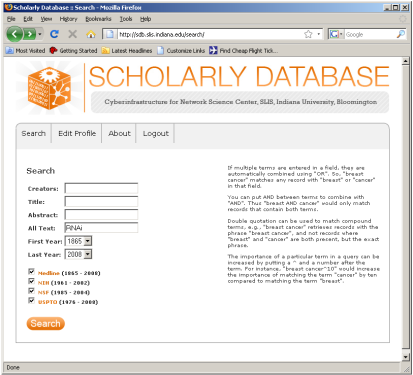
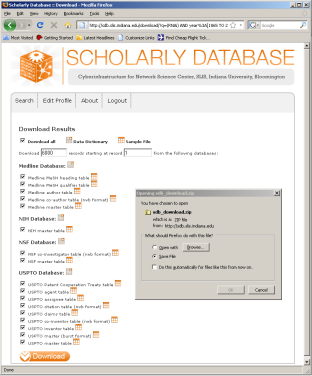
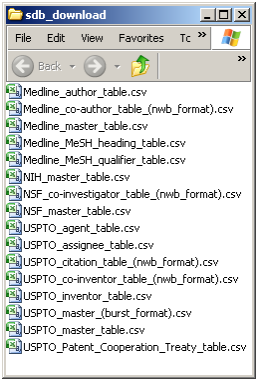
Figure 5.33: Downloading and saving RNAi data from the Scholarly Database.
To view the co-authorship network of Medline's RNAi records, go to 'File > Load' and open 'yoursci2directory/sampledata/scientometrics/sdb/RNAi/Medline_co-author_table(nwb_format).csv'_ in Standard csv format (if the file is not in the sample data directory it can be downloaded from 2.5 Sample Datasets). SDB tables are already normalized, so simply run 'Data Preparation > Extract Co-Occurrence Network' using the default parameters:
According to 'Analysis > Networks > Network Analysis Toolkit (NAT)', the output network has 21,578 nodes with 131 isolates, and 77,739 edges. Visualizing such a large network is memory-intensive, so extract only the largest connected component by running 'Analysis > Networks > Unweighted and Undirected > Weak Component Clustering' with the following parameters:
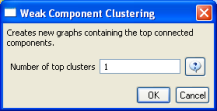
Make sure the newly extracted network ("Weak Component Cluster of 6446 nodes") is selected in the data manager, and run 'Visualization > Networks > GUESS' followed by 'Layout > GEM'. A custom python script has been used to color and size the network in Figure 5.34.
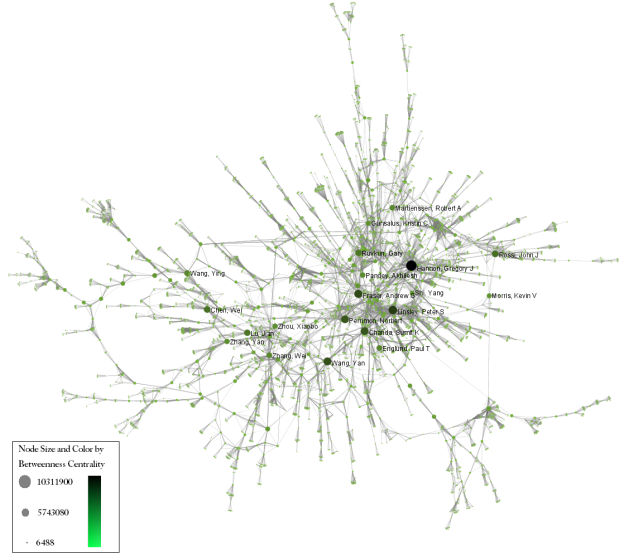
Figure 5.34: The Medline RNAi Co-authorship Network
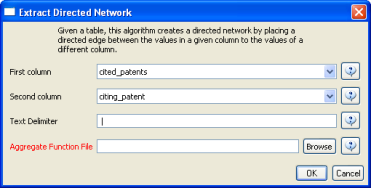
To visualize the citation patterns of patents dealing with RNAi, load 'yoursci2directory/sampledata/scientometrics/sdb/RNAi/USPTO_citation_table(nwb_format).csv'_ in Standard csv format (if the file is not in the sample data directory it can be downloaded from 2.5 Sample Datasets). Then run 'Data Preparation > Extract Bipartite Network' using the following parameters:

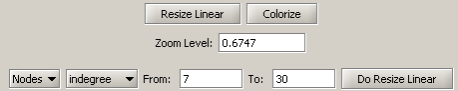
Run 'Analysis > Networks > Unweighted & Directed > Node Indegree' to append Indegree attributes to each node, and then visualize "Network with indegree attribute added to node list" using 'Visualization > Networks > GUESS' followed by 'Layout > GEM' and 'Layout > Bin Pack'. In the graph modifier pane, use the following parameters and click "Do Resize Linear."
Then select "nodes based on ->" in the Object drop-down box, "bipartitetype" in the Property drop-down box, "==" in the Operator drop-down box, and "cited_patents" in the Value drop-down box. Press "Colour" and click on blue below.
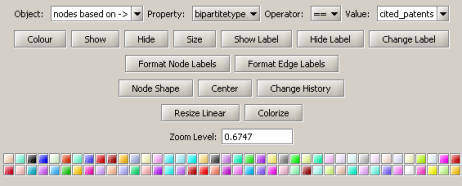
Repeat the previous steps, but change the Value to "citing_patent" and select the color red. Now press "Show Label". The resulting graph should look like Figure 5.35.
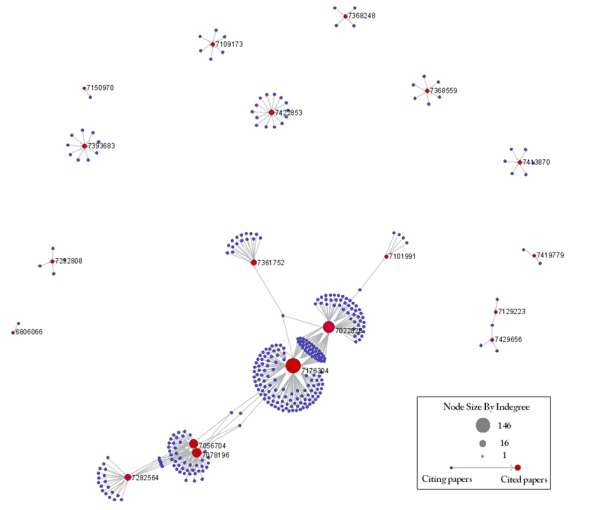
Figure 5.35: USPTO Patent citation network on RNAi
The SDB also outputs much more robust tables, for example 'yoursci2directory/sampledata/scientometrics/sdb/RNAi/Medline_master_table.csv'. This table includes full records of Medline papers, and will be used to find bursting terms from Medline abstracts dealing with RNAi. You can download the file by clicking here.
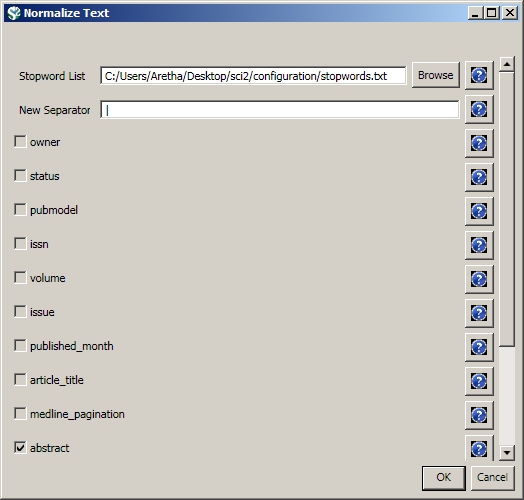
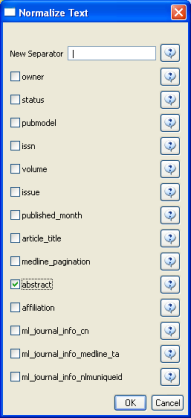
Load the file in Standard csv format and run 'Preprocessing > Topical > Lowercase, Tokenize, Stem, and Stopword Text' with the following parameters:
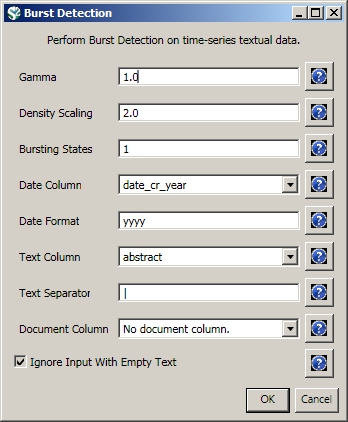
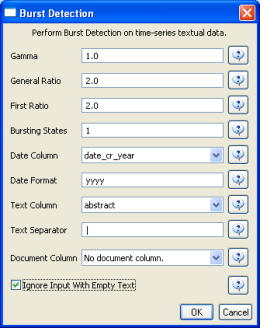
Select the "with normalized abstract" table in the Data Manager and run 'Analysis > Topical > Burst Detection' with the following parameters:
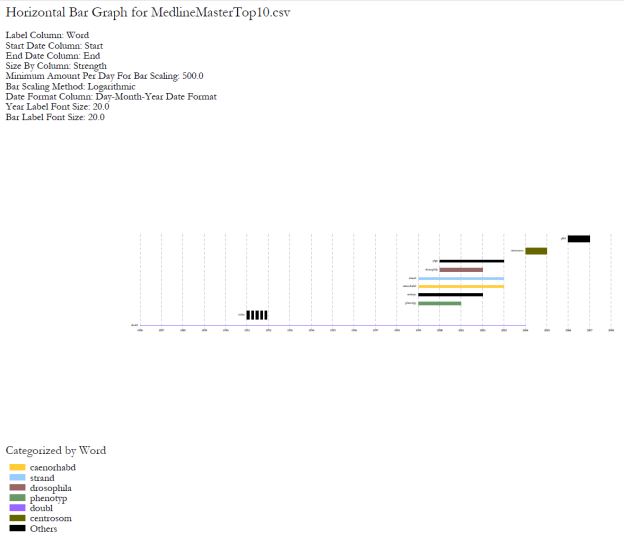
View the file "Burst detection analysis (date_cr_year, abstract): maximum burst level 1." There are more words than can easily be viewed with the horizontal bar graph, so sort the list by "Strength" and prune all but the strongest 10 words. In other words save the file from the data manager and sort the file by the weight column. Delete all but the top 10 rows. Save the file as a new .csv and load it into the Sci2 Tool as a standard csv file.
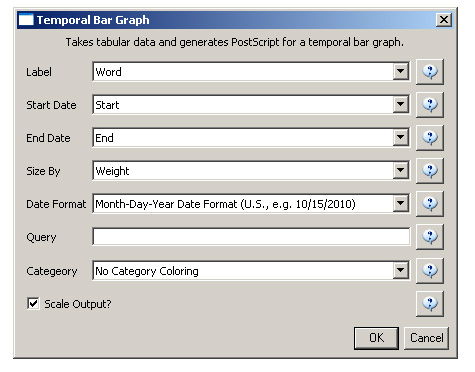
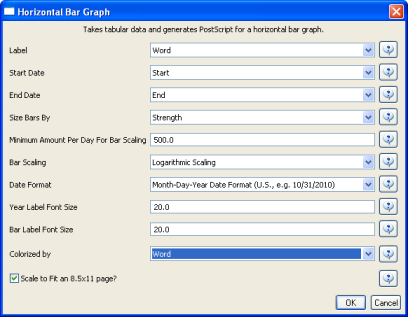
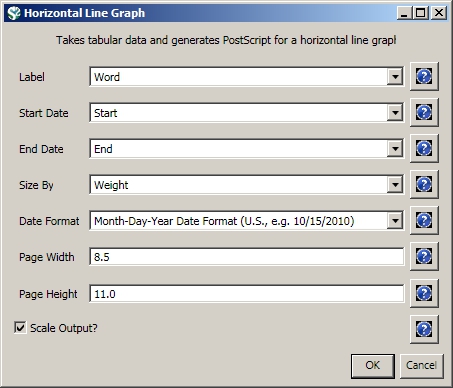
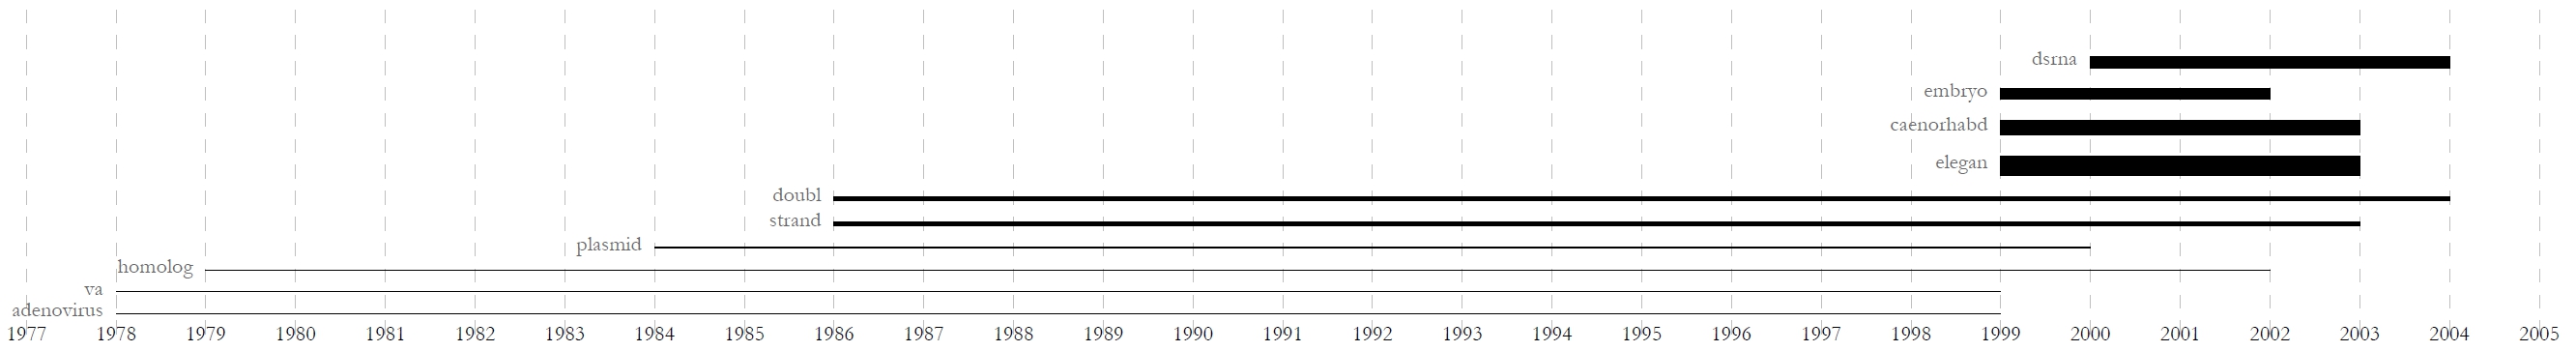
Select the new table in the data manager and visualize it using 'Visualize > Temporal > Horizontal Bar Graph (not included version)Temporal Bar Graph' with the following parameters:
Save and view the resulting PostScript file using the workflow described in section 2.4 Saving Visualizations for Publication.
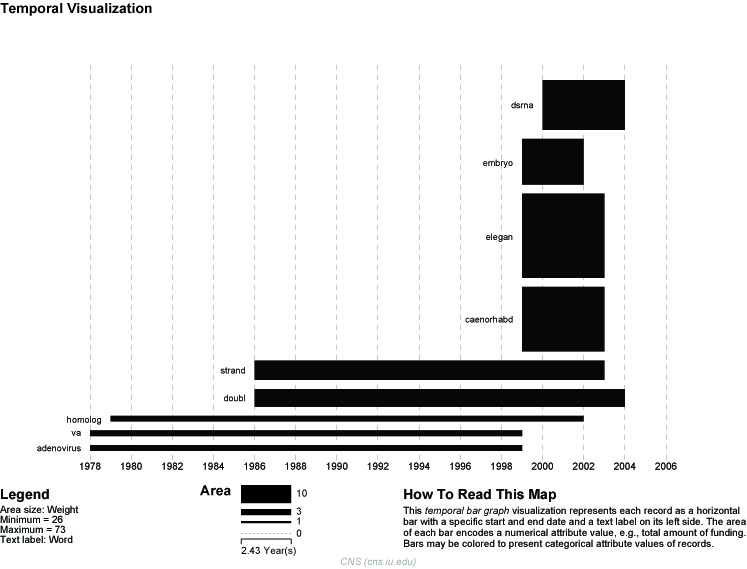
Figure 5.36: Top ten burst terms from Medline abstracts on RNAi Global Level Studies – Meso
To see the log file from this workflow save the 5.2.6 Mapping the Field of RNAi Research (SDB Data) log file.