Typically, about 80 percent of total project efforts is spent on data acquisition and preprocessing; yet well prepared data is mandatory to arrive at high-quality results. Datasets might be acquired via questionnaires, crawled from the Web, downloaded from a database, or accessed as a continuous data stream. Datasets differ by their coverage and resolution of time (days, months, years), geography (languages and/or countries considered), and topics (disciplines and selected journal sets). Their size ranges from several bytes to terabytes (trillions of bytes) of data. They might be high-quality materials curated by domain experts or random content retrieved from the Web. Based on a detailed needs analysis and deep knowledge about existing databases, the best suited yet affordable datasets have to be selected, filtered, integrated, and augmented. It may also be necessary for networks to be extracted (see section 4.7 Network Analysis for details).
4.2.1 Datasets: Publications
4.2.1.1 Refer/BibIX/enw
Refer was one of the first digital reference managers, developed by Bell labs in 1978. Refer's file output format has since been adopted by many tools and web services, including BibIX for UNIX, early versions of EndNote, CiteSeerX, Zotero.
Data in refer-formatted files can be used for the following types of analyses:
- Statistical Attributes** %1 (Times Cited)
- Temporal Analysis** %8 (Date)** %V (Volume)** %D (Year Published)
- Geospatial Analysis** %+ (Author Address)** %C (Place Published)
- Topical Analysis** %X (Abstract)** %J (Journal)** %K (Keywords)** %F (Label)
- %! (Short Title)
- %T (Title)
- Network Analysis** %A (Author)
4.2.1.2 BibTeX
Like Refer, BibTeX provides a standard reference file format used by many tools and web services, including CiteSeerX, citeulike, BibSonomy, and Google Scholar.
Data in BibTex files can be used for the following types of analyses:
- Temporal Analysis** date** bibdate** date-added** date-modified
- issue
- month
- timestamp
- volume
- year
- Geospatial Analysis** address** location
- Topical Analysis** abstract** booktitle** conference** description
- journal
- keywords
- Network Analysis** author** organization
4.2.1.3 ISI Web of Science
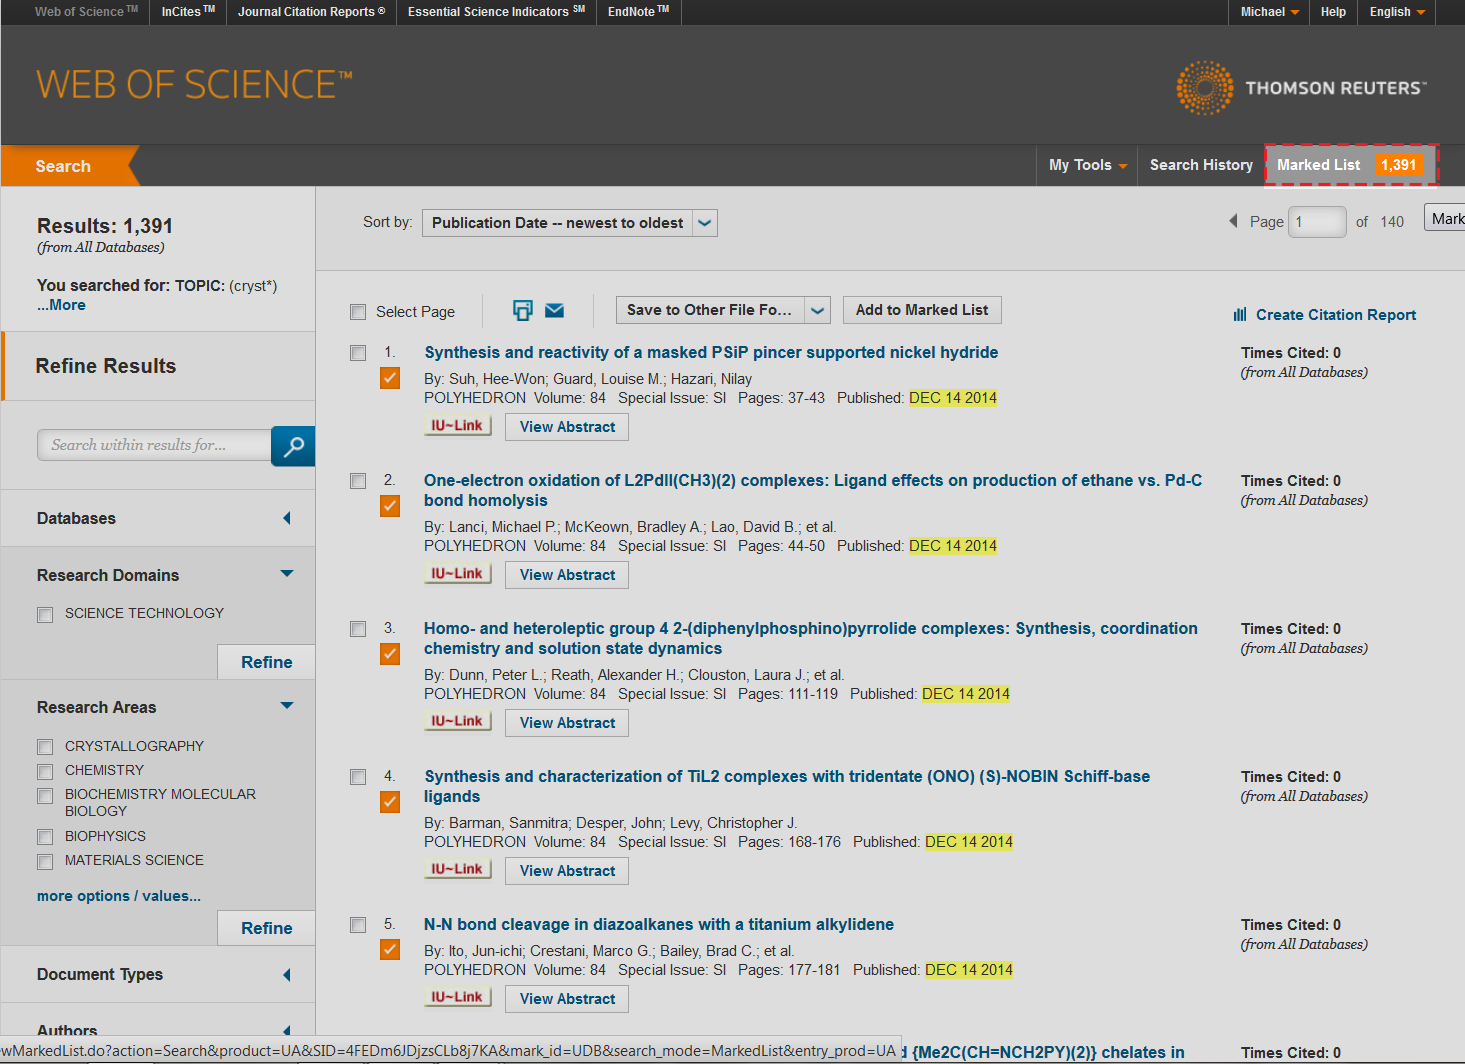
ISI Web of Science (WoS) is a leading citation database cataloging over 10,000 journals and over 120,000 conferences. Access it via the "Web of Science" tab at http://www.isiknowledge.com (note: access to this database requires a paid subscription). Along with Scopus, ISI WoS provides some of the most useful data sets for scientometric analysis. Publications may be obtained by querying the Web of Science database by a variety of fields within the database, such as topic, author and journal names, date ranges, etc. There are two methods for exporting data from Web of Science: direct data exporting from the search interface, and through adding records to a marked list. Direct data exporting from searches provides the fastest method to gather the most used data fields in a search, and provides less room for user selection bias of a group of records. Web of Science Marked Lists allow users to select only the records that interest them and select specific data to be exported from the various databases that a user's institution subscribes to.
4.2.1.3.1 ISI Web of Science - Direct Exporting
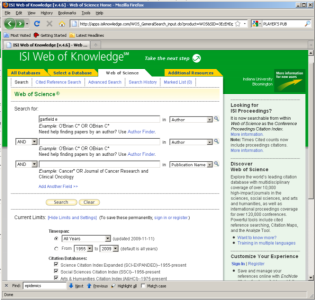
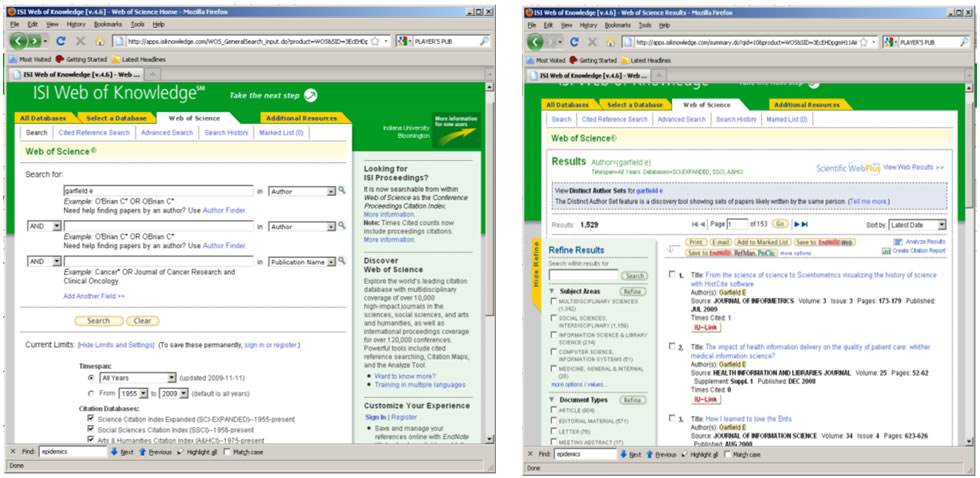
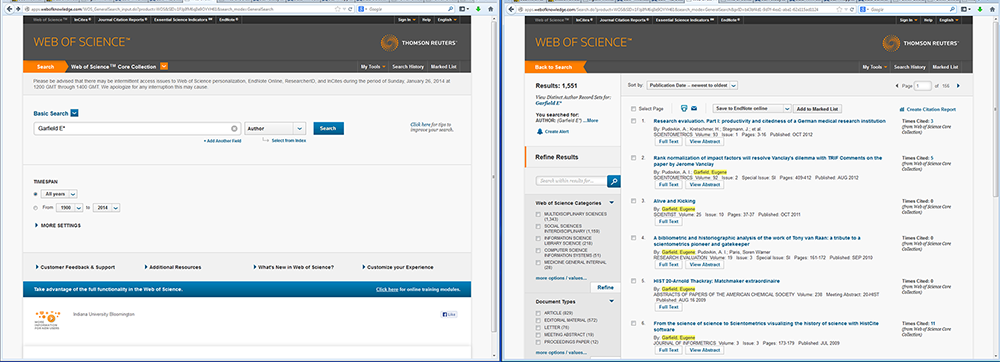
In this tutorial, we will download publication data using a query with an author name. Author names should be searched using the last name and the first initial followed by an asterisk wildcard in the author field. To find papers by Eugene Garfield, enter Garfield E* in the author field. The search yielded 725 results on April 23, 2016, 500 of which can be downloaded at a time, see Figure 4.2a.

Figure 4.2a: ISI Web of Science search interface and ISI Web of Science search results
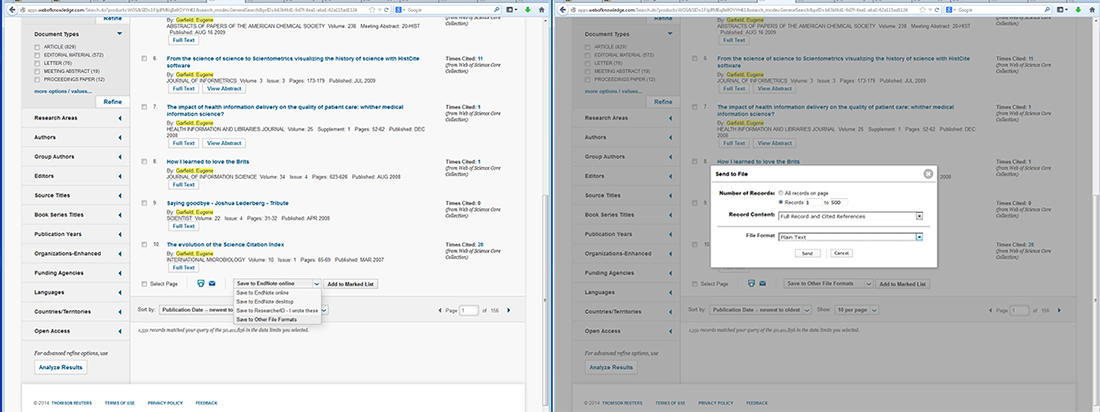
To download the first 500 article records with citations, go to the bottom of the page, and from the drop down menu next to the printing and email icons, select "Save to Other File Formats". A box will appear on the screen where you can manually select records '1' to '500', select 'Full Record and Cited References', select 'Save to Plain Text' in the drop down menu, and then click send, see figure 4.2b. This process can be repeated to obtain records and citations by adjusting the manually selected records by units of 500, e.g. select records "501" to "725" for the Garfield example.

Figure 4.2b: Saving records from Web of Science
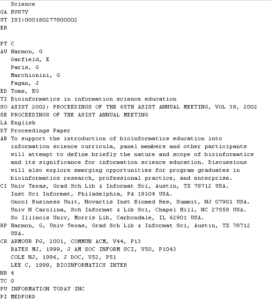
Wait for the processing to complete, and then save the file as GarfieldE.isi. The resulting file can be seen in Figure 4.2c.
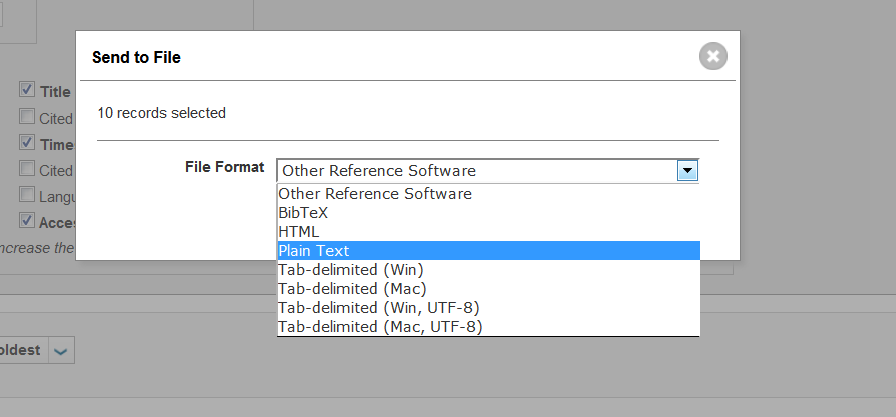
Figure 4.2c: Saving Records from Web of Science
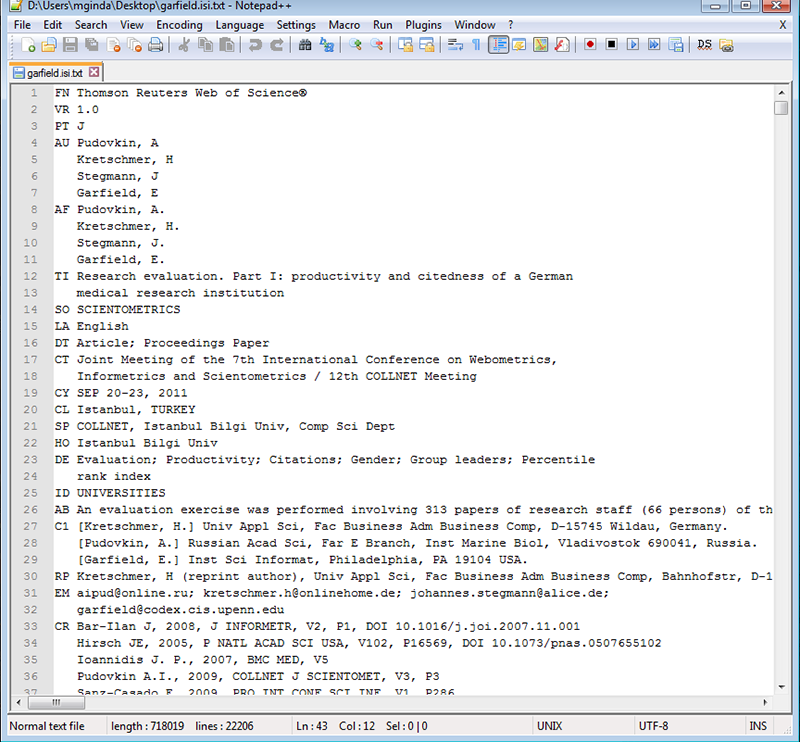
Figure 4.2d: View of saved GarfieldE.isi
4.2.1.3.2 ISI Web of Science - Marked List Data Exporting
Downloading WoS data from a marked list is very similar to the process of downloading data directly from the search page. With this tutorial, we will skip the instructions on how to run a basic WoS search, which is described in the section above.
After you have refined your search query to the WoS database, you will want to add records to your Marked List. To do this, you may select individual articles using the check boxes next to a publication record and then selecting the button, "Add to Marked List", see figure 4.2e.
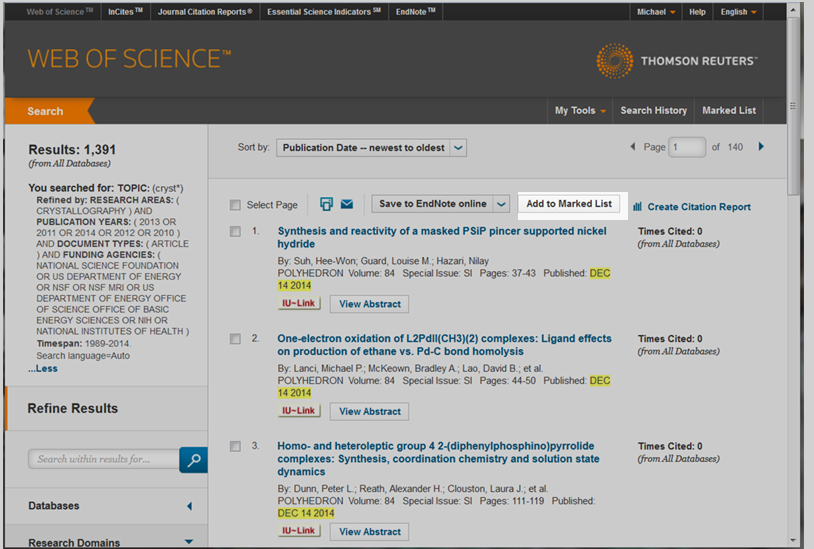
Figure 4.2e: Locating the Marked List button on Web of Science
You may also add records to the Marked List using a range of publication records in a search result. To do this, select the "Add to Marked List" button in the search result page without adding marks to individual publication records. Next, a box will pop up in the screen that allows you to enter a range for the publication records that you are interested and then select the "Add" button, see figure 4.2f for a picture of this screen.
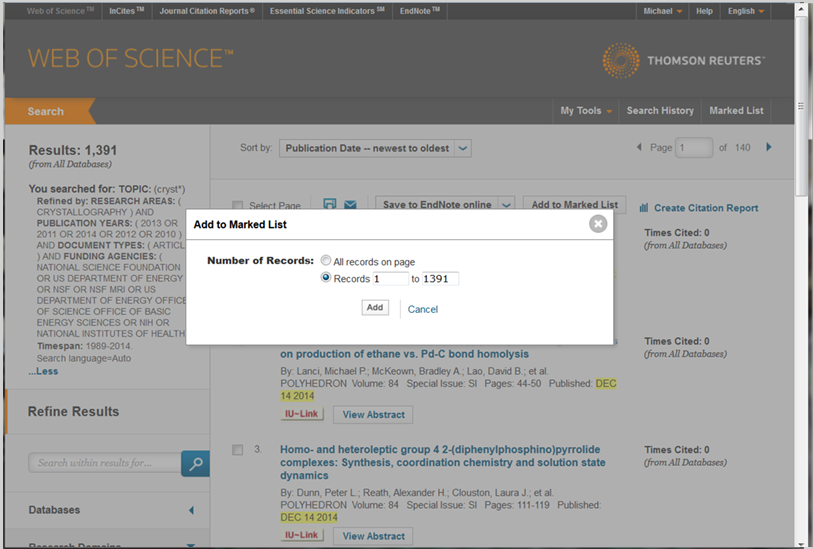
Figure 4.2f: Specifying a the range of records in a Marked List on Web of Science
You will notice that the publications you have selected in the search page will now have orange checks next to them, and the Marked List tab on the Navigation bar for the site will be updated to include the total number of records in your list. After you've completed adding publication records to your marked list you will want to visit the Marked List page. Click on the link in the navigation bar named "Marked List" that has an orange count box next to it, see figure 4.2g.

Figure 4.2g: Click the Marked List link in the navigation bar to access the Marked List page on Web of Science
The Marked List page provides you with a list of publications selected and various means of exporting publication data, including limiting exports to specific databases that are part of the WoS database. To export the most amount of data from WoS and to ensure the most replicable results, it is best to choose the Web of Science Core Collection export tool. The export tool outlines the various steps you will need to take: from selecting the exported records, selecting the content for exporting, and the format that the data will come in, see figure 4.2h for a view of this export tool.
The Web of Science Core Collection export tool allows you to select a variety of fields, including correspondence addresses of researchers, funding information, cited reference lists, keywords and WoS categories and research areas, etc.
Like direct data exporting, make sure to select the format option "Save to Other File Formats" and Plain Text. You will also be limited to exporting 500 records at a time, which means that you will have to combine data sets manually after downloading all publications (see for instructions here).
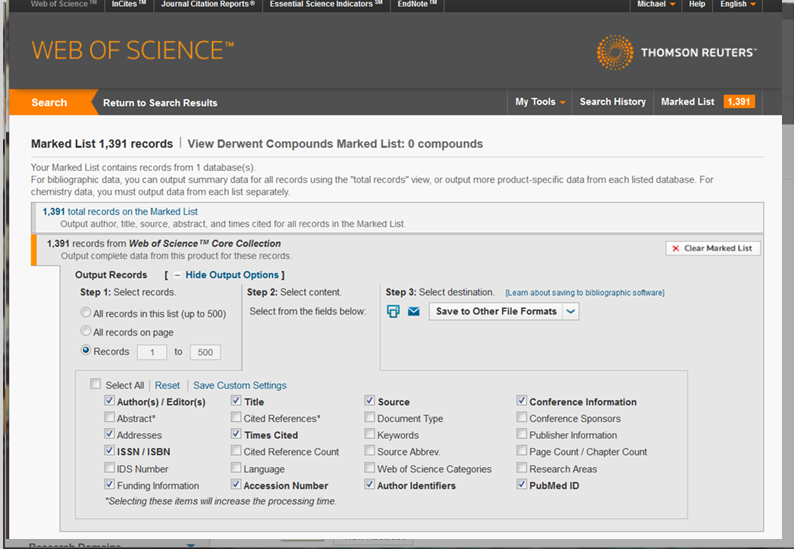
Figure 4.2h: Selecting data fields and exporting data from a Marked List
ISI files are loosely based on the RIS file format, and data in this format can be used for the following types of analyses:
- Statistical Attributes** NR (Cited Reference Count)** TC (Times Cited)
- Temporal Analysis** RC (Date / Date Modified)** PD (Date Published)** IS (Issue)** CY (Meeting Date)
- VL (Volume)
- PY (Year)
- Geospatial Analysis** AD (Address)** C1 (Author Address)** CL (Meeting Location)** PA (Publisher Address)
- PI (Publisher City)
- RP (Reprint Address)
- Topical Analysis** AB (Abstract)** BS (Book Series Subtitle)** SE (Book Series Title)** CT (Conference Title)
- ID (Index Keywords)
- CT (Meeting Title)
- MH (MeSH Terms)
- A2 (Other Abstract)
- SO (Source)
- TI (Title)
- FT (Vernacular Title)
- Network Analysis** AU (Author)** CR (References)** IV (Investigators)** AN (PubMed ID)
4.2.1.4 Scopus
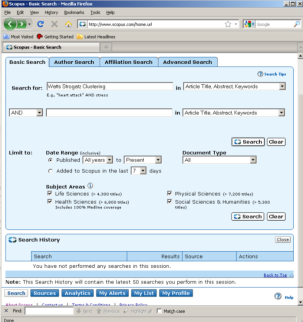
Elsevier's Scopus, like ISI Web of Science, has an extensive catalog of citations and abstracts from journals and conferences. Subscribers to Scopus can access the service via http://www.scopus.com. Scopus provides a multiple methods to search and analyze citations and abstracts: by document, authors, institutional affiliations, and advanced Boolean search.
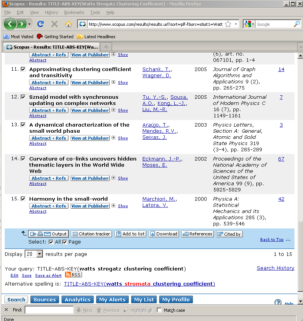
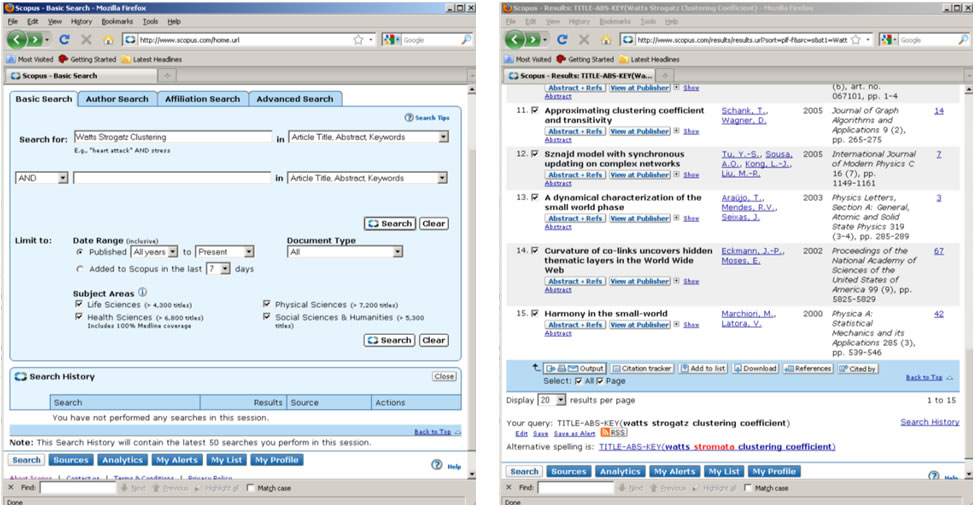
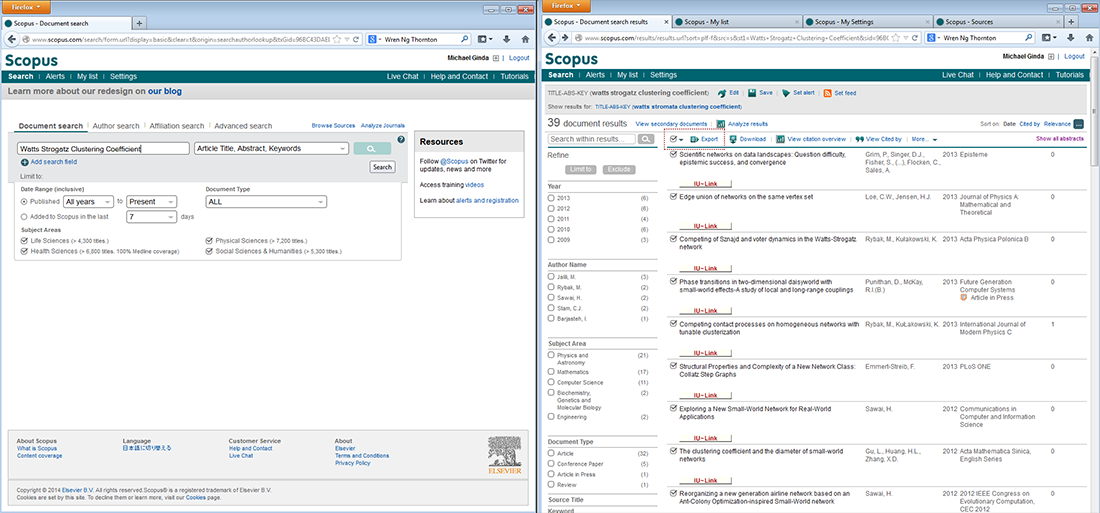
To find all articles whose abstract, title, or keywords include the terms 'Watts Strogatz Clustering Coefficient', simply enter those terms in the Article/Abstract/Keywords field. Forty-nine results were found as of April 29, 2016. You can download the references (up to 2,000 full records, and 20,000 "Citations Only" in a CSV file) by checking the 'Select All' box and clicking on the down arrow next to 'RIS Export' and choosing the file type you wish to export the references as. You can export in RIS Format (this is for EndNote, or other Reference Managers), CSV as mentioned earlier, BibTeX, or as a .txt file. Once you have chosen the desired format, click on the 'Export' button on the bottom right of the drop down menu.
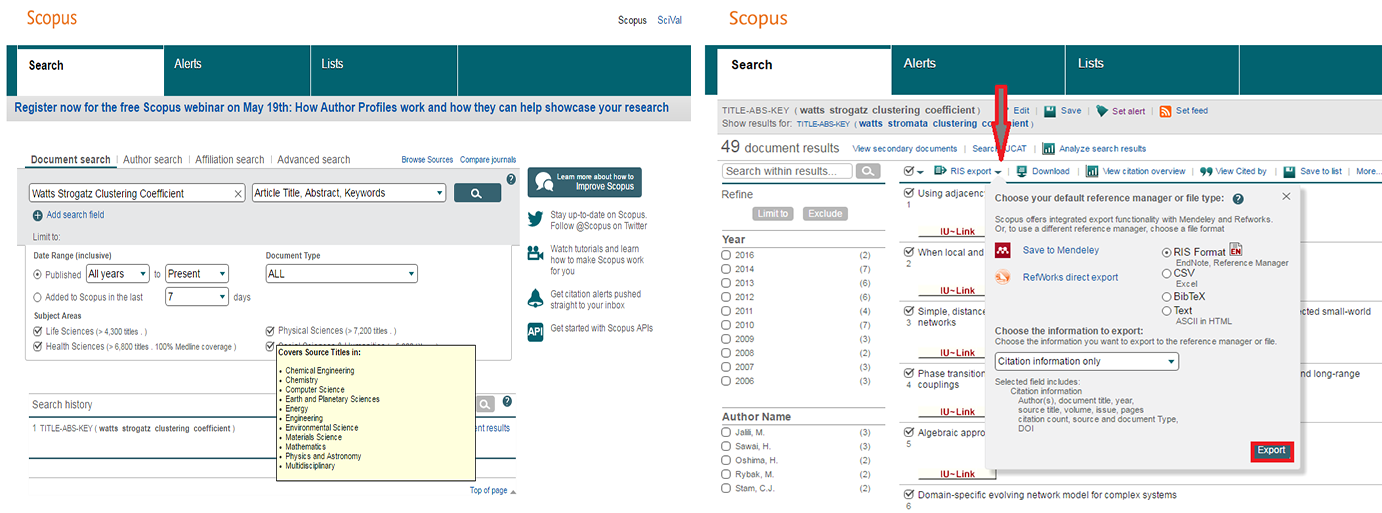
Figure 4.2i: Scopus search interface and Scopus search results
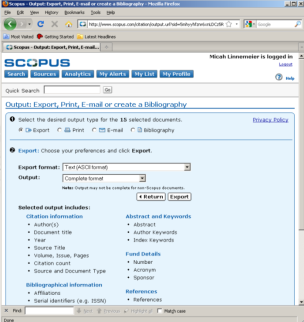
At the export screen, select 'Comma separated file, .csv' (e.g. Excel) and select the types of information that you will need. For our purposes, select 'All available information' from the drop-down menus and choose 'Export'.
Save the file as WattsStrogatz.scopus. The resulting file can be seen in Figure 4.2j.

Figure 4.2j: Saving records in Scopus and viewing WattsStrogatz.scopus
Data in Scopus files can be used for the following types of analyses:
- Temporal Analysis** Issue** Volume** Year
- Geospatial Analysis** Correspondence Address
- Topical Analysis** Abstract** Author Keywords** Conference Name** Index Keywords
- Source Title
- Source
- Title
- Network Analysis** Authors** References
4.2.1.5 Google Scholar
Google Scholar data can be acquired using Publish or Perish (Harzing, 2008) that can be freely downloaded from http://www.harzing.com/pop.htm. A query for papers by Albert-László Barabási run on April 29, 2016 results in 280 papers that have been cited 92,213 times, see Figure 4.2k.

Figure 4.2k: Publish or Perish search results for Albert-László Barabási and viewing barabasiPoP.csv
To save records, select 'File > Save' from menu and then choose the appropriate file format (.csv, *.enl, or *.bib) in the 'Choose File' pop-up window. All three file formats can be read by the Sci2 Tool. The result in all three formats named 'barabasi.' is also available in the respective subdirectories in 'yoursci2directory /sampledata/scientometrics/' and will be used later in this tutorial.
Data from Google Scholar can be used for the following types of analyses:
- Statistical Attributes** Cites
- Temporal Analysis** Year
- Topical Analysis** Source** Title
- Network Analysis** Authors
4.2.1.5.1 Google Citation
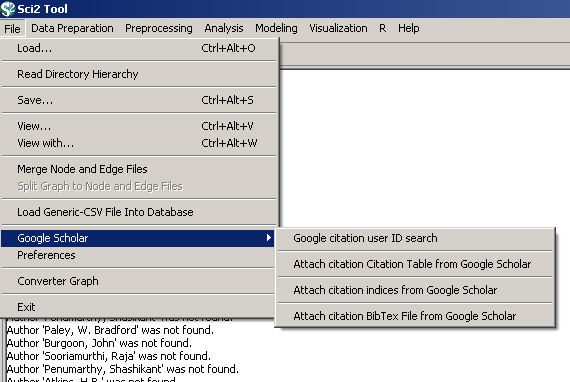
Data from Google Scholar can also be gathered based on Google Citation user IDs. Once any dataset with author information has been loaded into Sci2 (.isi, .enl etc.) run File > Google Scholar > Google citation user ID search' with the following parameter:

A list of authors for whom no Google Citation user ID could be found will print in the console. A table will be generated for those authors for whom Google Citation IDs could be found in the data manager:

Based on this table a variety of algorithms that require the Google Citation User ID as an input parameter can be run:
Please note that before any of the following algorithms can be run, the Google Citation User ID Search algorithm must be run to retrieve the Google Citation User IDs.
Attach Citation Table from Google Scholar
This algorithm creates a series of tables, one for each Google User ID, and creates tables with citation information for each Google Citation ID. Run 'File > Google Scholar > Attach Citation Table from Google Scholar' with the default parameter.
- Statistical Attributes** Cites
- Temporal Analysis** Year
- Topical Analysis** Title
- Network Analysis** Authors
Attach citation indices from Google Scholar
This algorithm will create a citation index of the authors from the original file based on their Google Citation user ID (for those who have one). Run 'File > Google Scholar > Attach citation indices from Google Scholar' with the default parameter.
- Statistical Attributes** Cites**h-index **i10-index
- Network Analysis** Citation User ID
4.2.2 Social Media
4.2.2.1 Facebook
An individual with a Facebook account can download their Facebook Friends data and Mutual Friends data using the Sci2 Tool.
To download your Facebook data, open the Sci2 Tool and select the "Facebook" option in the file menu. In the next submenu, select the "Access Token" option. You may be asked to log into your account; afterwards, you will be redirected to a webpage that provides you with an access token. In your browser, right click on the grey text, choose "Select All", and then copy this text to your clipboard. Figure 4.2l demonstrates this process.
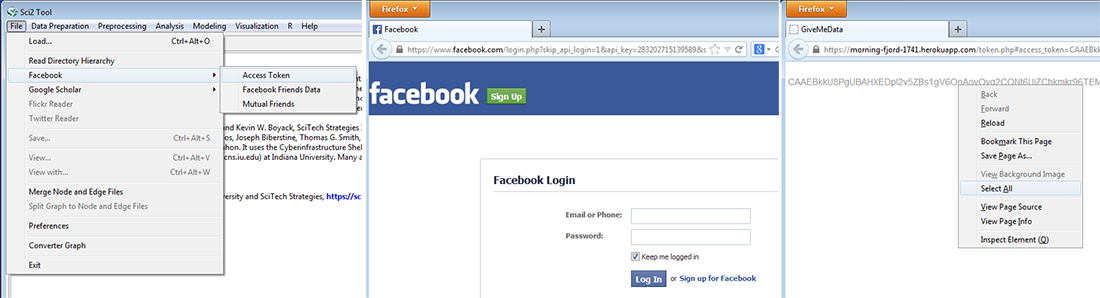
Fig. 4.2l: Use Sci2 to gain access and retrieval of Facebook Access Token
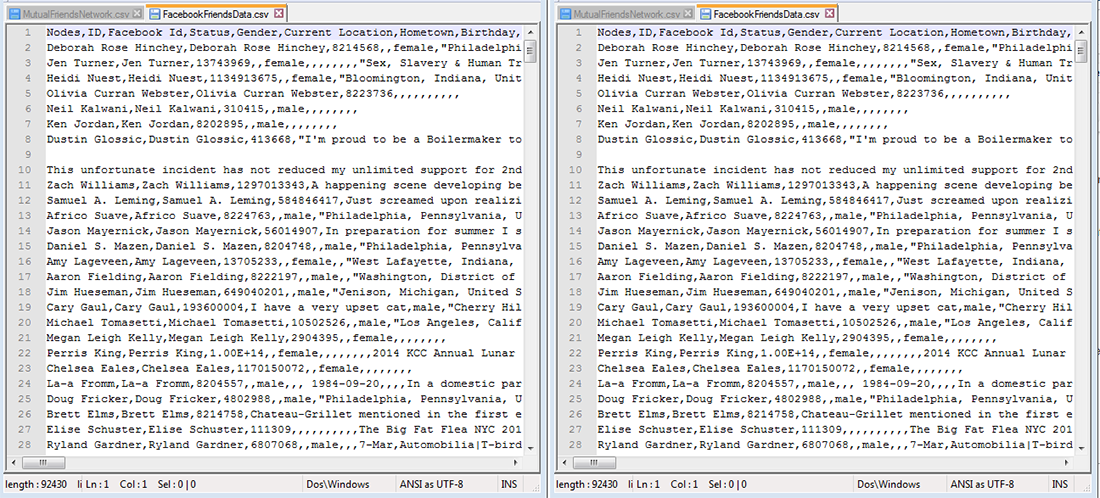
After you have copied your access token, return to the Sci2 Tool and the file menu. In the "Facebook" sub-menu, select either "Facebook Friends Data" or "Mutual Friends". A window will pop up, like in figure 4.2m. Paste your access token into the text field and hit the "OK" button.
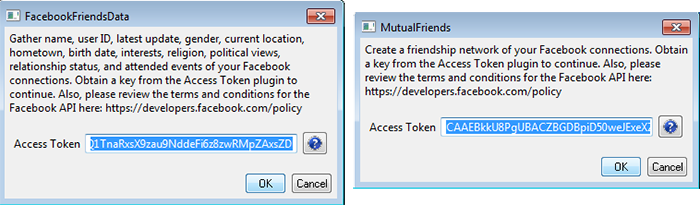
Fig 4.2m: Sci2 Tool's Facebook Friends Data and Mutual Friends data load windows with access tokens
Your data will load into the data manager as a comma separated values (.csv) file for you to use. You can save the data to your computer by right clicking the file in the data manager and selecting "Save" from the menu. A new window will pop up, allowing you to choose the a directory and new name for the data being saved.
Data that you downloaded from Facebook can be used to perform
- Statistical Attributes** Gender, Interests, Political Views, Relationships
- Geospatial Analysis** Current Location and Hometown
- Topical Analysis** Status, Interests
- Network Analysis** Mutual Friends
4.2.3 Datasets: Funding
4.2.3.1 NSF Award Search
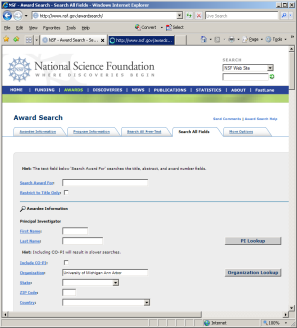
Funding data provided by the National Science Foundation (NSF) can be retrieved via the Award Search site (http://www.nsf.gov/awardsearch). Search by PI name, institution, and many other fields, see Figure 4.9.
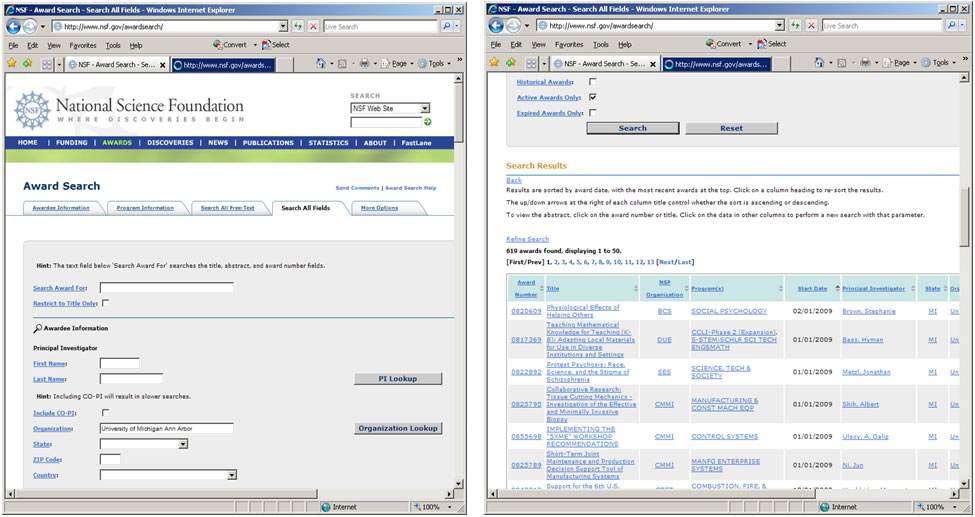
Figure 4.2n: NSF 'Award Search' interface and search results page
To retrieve all projects funded under the Science of Science and Innovation Policy (SciSIP) program, simply select the 'Advanced Searcg' tab, enter '7626' into the 'Element Code' field which is under the 'Program Information' section, and click the 'Search' button. On April 23, 2016, exactly 124 awards were found. Award records can be downloaded in csv, Excel, XML, or .txt format. Save file in csv format, and change the file extension from .csv to .nsf. A sample .nsf file is available in 'yoursci2directory /sampledata/scientometrics/nsf/BethPlale.nsf'. In the Sci2 Tool, load the file using 'File > Load File'. Select "NSF csv format" in the "Load" pop-up window. A table with all records will appear in the Data Manager. View the file in Excel.
Data in NSF files can be used for the following types of analyses:
- Network Analysis** Principle Investigator** Co-PI Name(s)** Organization
- Temporal Analysis** Expiration Date** Start Date
- Geospatial Analysis** Organization City** Organization State** Organization Street Address** Organization Zip
- Topical Analysis** Abstract** NSF Organization** Title
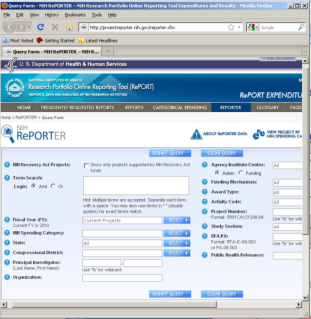
4.2.3.2 NIH RePORTER
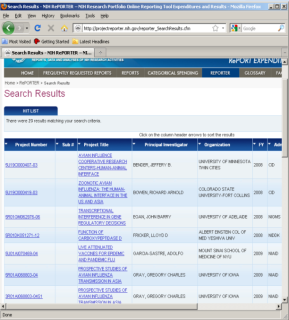
Funding data provided by the National Institutes of Health (NIH), and associated publications and patents, can be retrieved via the NIH RePORTER site (http://projectreporter.nih.gov/reporter.cfm). The database draws from eRA, Medline, PubMed Central, NIH Intramural, and iEdison. Search by location, PI name, category, etc., see Figure 4.2o.
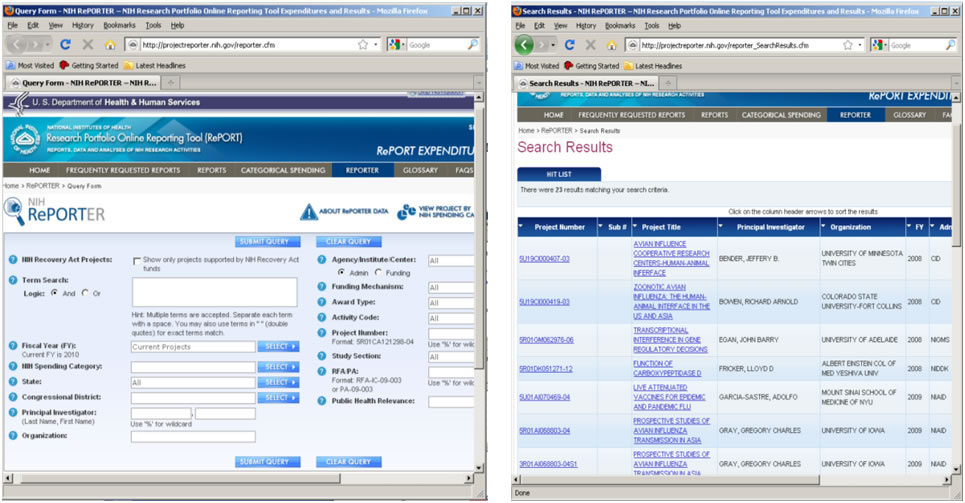
Figure 4.2o: NIH RePORTER search interface and search results page
A sample search of "Epidemic" in the 'Public Health Relevance' field displays 205 results as of November 11th, 2009. Up to 500 results can be exported into csv or Excel format using the "Export" button at the top of the page. Save the file as a .csv and load it into the Sci2 Tool using 'File > Load File' to perform temporal or topical analyses.
Data in NIH files can be used for the following types of analyses:
- Statistical Attributes** Type
- Temporal Analysis** Year of award
- Topical Analysis** Abstract** Project Title
- Network Analysis** Principle Investigator** Organization** Project Number
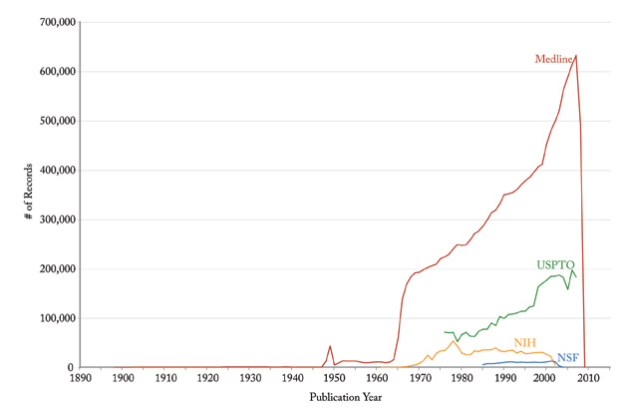
4.2.4 Datasets: Scholarly Database
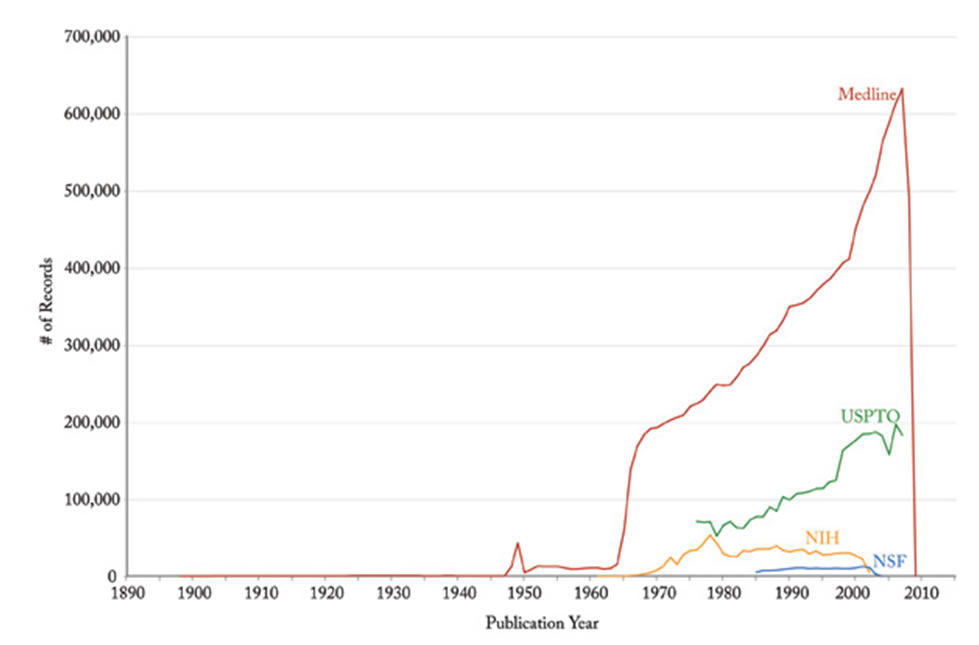
Figure 4.2p: Graph of the numbers of records published each year by various organizations
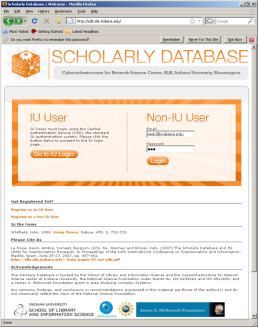
Medline, U.S. patent, as well as funding data provided by the National Science Foundation and the National Institutes of Health can be downloaded from the Scholarly Database (SDB) at Indiana University. SDB supports keyword based cross-search of the different data types and data can be downloaded in bulk, see Figures 4.2q and 4.2r for interface snapshots.
Register to get a free account or use 'Email: nwb@indiana.edu' and 'Password: nwb' to try out functionality.
Search the four databases separately or in combination for 'Creators' (authors, inventors, investigators) or terms occurring in 'Title,' 'Abstract,' or 'All Text' for all or specific years. If multiple terms are entered in a field, they are automatically combined using the Boolean operator 'OR.' Entering 'breast cancer' will match any record with 'breast' or 'cancer' in that field. Using the Boolean operator AND (for example, 'breast AND cancer') would only match records that contain both terms. Double quotations can be used to match compound terms, e.g., "breast cancer" retrieves records with the phrase "breast cancer," but not records where 'breast' and 'cancer' are present in isolation. The importance of a particular term in a query can be increased by putting a ^ and a number after the term. For instance, 'breast cancer^10' would increase the importance of matching the term 'cancer' by ten compared to matching the term 'breast.'
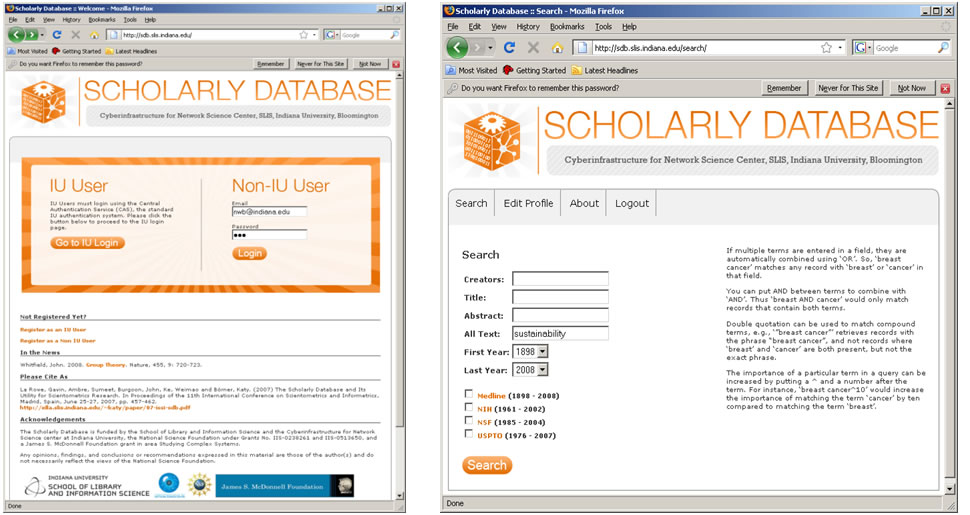
Figure 4.2q: Scholarly Database 'Home' page and 'Search' interface
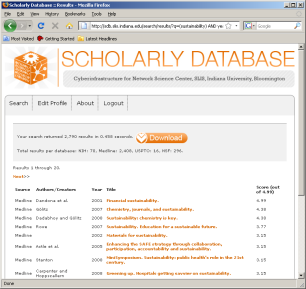
Results are displayed in sets of 20 records, ordered by a Solr internal matching score. The first column represents the record source, the second the creators, third comes the year, then title and finally the matching score. Datasets can be downloaded in different subsets and formats for future analysis.

Figure 4.2r: Scholarly Database search results and download interfaces
Data from the SDB can be used in a great number of ways. The following is an abridged list of suggested uses:
- Statistical Attributes** expected_total_amount** times_cited** citing_patents
- Temporal Analysis** issue_date** year** date_expires** project_end
- issue
- date_started
- project_start
- volume
- published_year
- Geospatial Analysis** address** street** city** state
- country
- zipcode
- residence
- Topical Analysis** abstract** descriptorname** nsf_org** title
- article_title
- Title
- Network Analysis** name** inventor** authors** cited_patents
- investigators
- pi_title