6.4.1 113 Years of Physical Review: Using Flow Maps to Show Temporal and Topical Citation (2008)
By Bruce W. Herr II, Russell Jackson Duhon, Katy Börner, Elisha F. Hardy, & Shashikant Penumarthy (2008)
We visualize 113 years of bibliographic data from the American Physical Society. The 389,899 documents are laid out in a two dimensional time-topic reference system. The citations from 2005 papers are overlaid as flow maps from each topic to the papers referenced by papers in the topic making intercitation patterns between topic areas visible. Paper locations of Nobel Prize predictions and winners are marked. Finally, though not possible to reproduce here, the visualization was rendered to, and is best viewed on, a 24" x 30" canvas at 300 dots per inch.
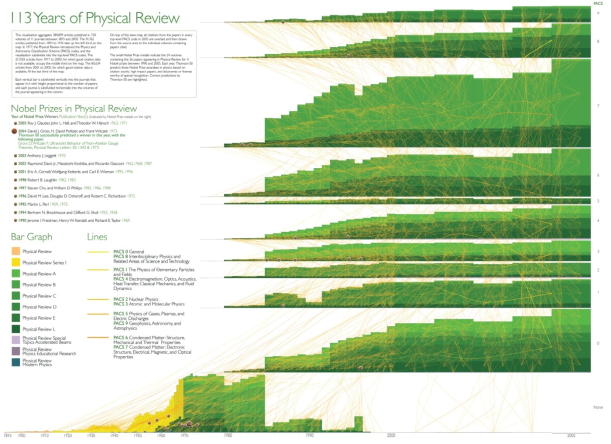
113 Years of bibliogaphic data from the American Physical Society
6.4.2 The Simultaneous Evolution of Author and Paper Networks (2004)
By Katy Börner, Jeegar Maru, & Robert Goldstone (2004)
There has been a long history of research into the structure and evolution of mankind's scientific endeavor. However, recent progress in applying the tools of science to understand science itself has been unprecedented because only recently has there been access to high-volume and high-quality data sets of scientific output (e.g., publications, patents, grants) and computers and algorithms capable of handling this enormous stream of data. This article reviews major work on models that aim to capture and recreate the structure and dynamics of scientific evolution. We then introduce a general process model that simultaneously grows coauthor and paper citation networks. The statistical and dynamic properties of the networks generated by this model are validated against a 20-year data set of articles published in PNAS. Systematic deviations from a power law distribution of citations to papers are well fit by a model that incorporates a partitioning of authors and papers into topics, a bias for authors to cite recent papers, and a tendency for authors to cite papers cited by papers that they have read. In this TARL model (for topics, aging, and recursive linking), the number of topics is linearly related to the clustering coefficient of the simulated paper citation network.

Total number of actual and simulated papers (#p) and authors (#a) (a) and received citations (#c_win) (b).