6.6.1 The Scholarly Database and Its Utility for Scientometrics Research (2009)
By Gavin LaRowe, Sumeet Ambre, John Burgoon, Weimao Ke, & Katy Börner (2009)
The Scholarly Database aims to serve researchers and practitioners interested in the analysis, modeling, and visualization of large-scale data sets. A specific focus of this database is to support macro-evolutionary studies of science and to communicate findings via knowledge-domain visualizations. Currently, the database provides access to about 18 million publications, patents, and grants. About 90% of the publications are available in full text. Except for some datasets with restricted access conditions, the data can be retrieved in raw or pre-processed formats using either a web-based or a relational database client. This paper motivates the need for the database from the perspective of bibliometric/scientometric research. It explains the database design, setup, etc., and reports the temporal, geographical, and topic coverage of data sets currently served via the database. Planned work and the potential for this database to become a global testbed for information science research are discussed at the end of the paper.
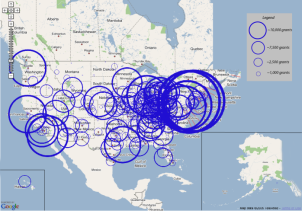
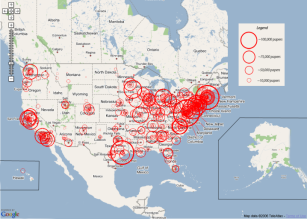
Map of NIH Grants (top) and MEDLINE Publications (bottom)
6.6.2 Reference Mapper
By Russel J. Duhon, Katy Börner (2007)
The RefMapper tool supports the automatic detection, mapping, and clustering of grant awards and proposals based on citation references. It might be used to group proposals for review or to communicate the topic coverage of a proposal/funding portfolio. The tool uses a master list of 18,351 journal names that are indexed by Scopus and Reuters/Thomson Scientific (ISI SCI, SSCI, and A&H Indexes) and a lookup table of 57,860 different abbreviations for those journal names. It science-locates identified journals on the 554 scientific areas of the UCSD Map of Science (Klavans, Boyack, 2007). Each of the 13 main scientific disciplines is labeled and color coded in a metaphorical way, e.g., Medicine is blood red and Earth Sciences are brown as soil. The RefMapper also identifies clusters based on reference co-occurrence similarity. The RefMapper tool was made available as a plugin to the Network Workbench (NWB Team, 2006; Cyberinfrastructure for Network Science Center, 2009). It can be downloaded for Windows and for Mac.
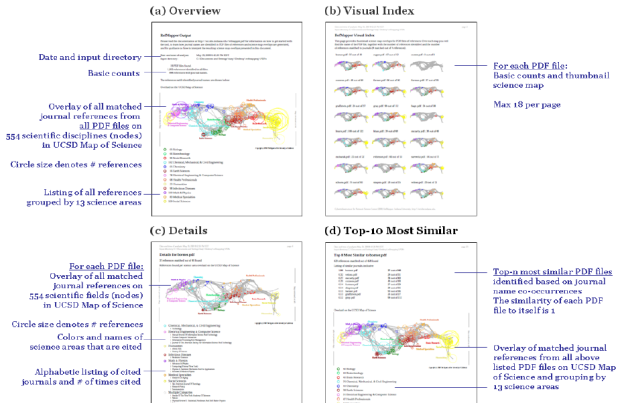
Presentation of RefMapper analysis results
6.6.3 Rete-Netzwerk-Red: Analyzing and Visualizing Scholarly Networks Using the Scholarly Database and the Network Workbench Tool (2009)
The enormous increase in digital scholarly data and computing power combined with recent advances in text mining, linguistics, network science, and scientometrics make it possible to scientifically study the structure and evolution of science on a large scale. This paper discusses the challenges of this 'BIG science of science' – also called 'computational scientometrics' research – in terms of data access, algorithm scalability, repeatability, as well as result communication and interpretation. It then introduces two infrastructures: (1) the Scholarly Database (SDB) (http://sdb.cns.iu.edu), which provides free online access to 20 million scholarly records – papers, patents, and funding awards which can be cross-searched and downloaded as dumps, and (2) Scientometrics-relevant plug-ins of the open-source Network Workbench (NWB) Tool (http://nwb.cns.iu.edu). The utility of these infrastructures is then exemplarily demonstrated in three studies: a comparison of the funding portfolios and co-investigator networks of different universities, an examination of paper-citation and co-author networks of major network science researchers, and an analysis of topic bursts in streams of text. The paper concludes with a discussion of related work that aims to provide practically useful and theoretically grounded cyberinfrastructure in support of computational scientometrics research, practice, and education.

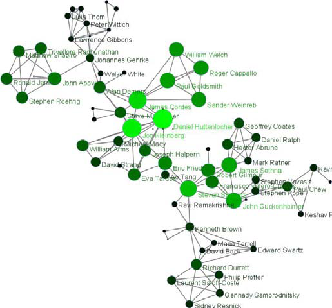
Complete network (left) and largest component (right) of Cornell University's co-investigator network (67 nodes).