There are three steps to visualizing VIVO Data in Sci2.
1. Query the desired institution using SPARQL to retrieve the VIVO Data
2. Using Sci2 run various preprocessing algorithms to clean up the data
3. Visualize the Data using GUESS
In this workflow the University of Florida VIVO data will be used to generate an organization Hierarchy Visualization.
Working with SPARQL to Retrieve VIVO Data
To retrieve all organizations and sub-organizations within the University of Florida (UFL) copy and paste the SPARQL query shown below into the text box at the University of Florida's SPARQLer - General purpose processor here.
PREFIX rdfs:  <http://www.w3.org/2000/01/rdf-schema#>
PREFIX foaf: <http://xmlns.com/foaf/0.1/>
PREFIX core: <http://vivoweb.org/ontology/core#>

SELECT (str(?orgLabel) as ?organizationLabel) (str(?subLabel) as ?subOrganizationLabel)
WHERE
{

?org rdfs:label ?orgLabel;
     core:hasSubOrganization/rdfs:label ?subLabel .
}
Once you have copied the code into the text box you can select the desired output. For manipulation data in Sci2 CSV files will work best. Select CSV output and save the file to your desktop. Once the file has been saved rename the file as OrganizationToSubOraganization.csv. This data set will contain sub-organizations that do not belong to any part of the University of Florida system.
Using the following SPARQL query to retrieve the UFL's organizations list from the UFL's SPARQLer. Save the file as UFLOrganizations.csv.
PREFIX rdfs:  <http://www.w3.org/2000/01/rdf-schema#>
PREFIX foaf: <http://xmlns.com/foaf/0.1/>
PREFIX core: <http://vivoweb.org/ontology/core#>

SELECT (str(?orgLabel) as ?UFLOrganizationLabel)
WHERE
{

<http://vivo.ufl.edu/individual/UniversityofFlorida> core:hasSubOrganization*/rdfs:label ?orgLabel .
}
Now, we want to extract all the rows of the OrganizationToSubOraganization.csv that belong to UFL. To do this, extract the rows from the OrganizationToSubOraganization.csv where their organizationLabel exists in the UFLOrganizations.csv. This can be done by using Excel, Python, etc. Save the result as UFLOrgHierarchy.csv
Loading VIVO Data in Sci2
Now open the Sci2 Tool and load the VIVO data by selecting "File > Load > UFLOrgHierarchy.org"
Cleaning and Preprocessing VIVO Data
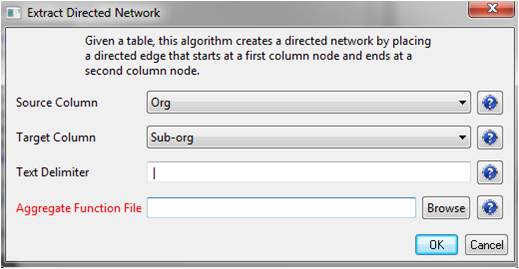
In the Sci2 Tool extract a directed network by running "Data Preparation > Extract Directed Network". Use the following parameters:
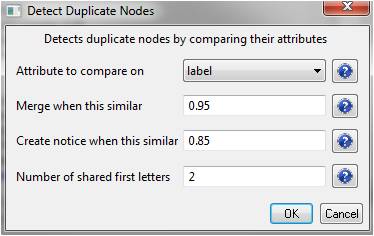
Next you will want to detect duplicate nodes. Run "Data Preparation > Detect Duplicate Nodes" with the default parameters:
A merge table and two log files will be generated. To remove the duplicate nodes, select the merge table and the directed network file, run "Data Preparation > Update Network by Merging Nodes".
Next generate the in-degree attributes by using the 'Updated Network' file and running "Analysis > Networks > Unweighted and Directed > Node Indegree". Then take the resulting network and generate the out-degree attributes by running "Analysis > Networks > Unweighted and Directed > Node Outdegree".
Visualizing in GUESS
Take the network that results from the above cleaning and preprocessing and visualize it in GUESS by running "Visualization > Networks > GUESS". This will take some time due to the size of the data set.
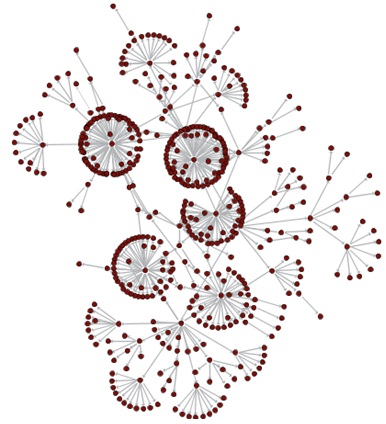
Once the network has been visualized change the layout by running "Layout > GEM / SPRING / Bin Pack" or any combination of these layouts to your satisfaction. The image below has used the SPRING layout and then Bin Pack.
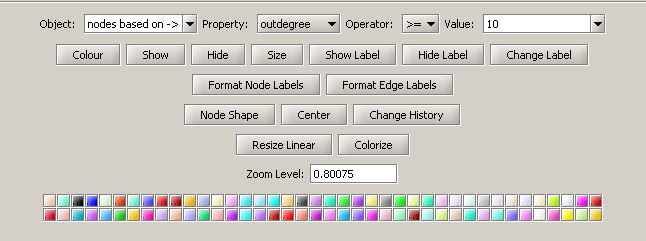
In order to further visualize the network you can use the Graph Modifier. To color the nodes that have more than 10 sub-organizations enter the parameters shown below into the Graph Modifier, select "Colour", and choose the desired color. You might also want to show the labels of these organizations.
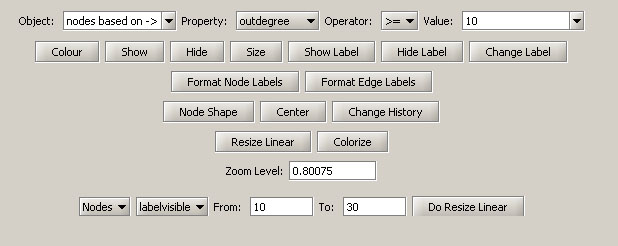
Next, you will want to re-size the nodes linearly based on the number of direct sub-organizations. To achieve this, click on the "Resize Linear" button and fill in the parameters as follows:
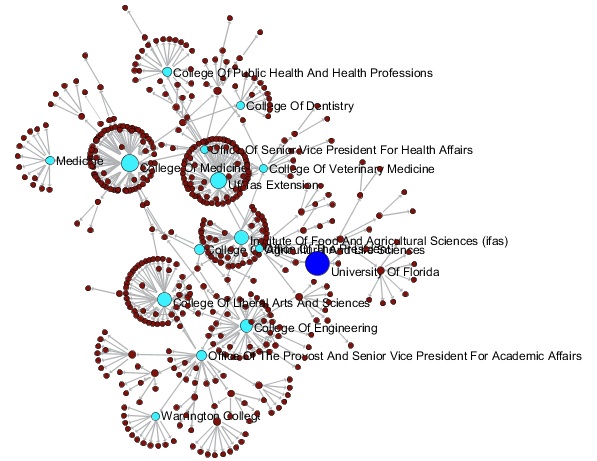
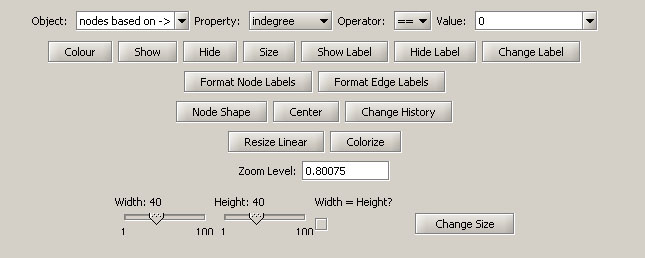
Finally, you can highlight the UFL node by coloring and resizing. Use the parameters as shown below to achive the highlight effect.
The result is a visualization of the UFL organization hierarchy.