CTSA2005-2009.xls |
|
Time frame: | 2005-2009 |
Region(s): | Miscellaneous |
Topical Area(s): | Clinical and Translational Science |
Analysis Type(s): | PI-Institution Network, Co-Authorship Network |
Data doesn't always come in easily parsible formats. This study, a search for all recent grants to CTSA centers, requires some advanced searching and data manipulation to prepare the required data. The data comes from the union of NIH RePORTER downloads (see section 4.2.2.2 NIH RePORTER) and NIH ExPORTER data dumps (http://projectreporter.nih.gov/exporter/). Each CTSA Center grant was found and matched with its associated publications using a project-specific ID.
The resulting file, which contains all NIH Clinical and Translational Science Awards and their corresponding details from 2005-2009, is saved in an Excel file in 'yoursci2directory/sampledata/scientometrics/nih/CTSA2005-2009' (if the file is not in the sample data directory it can be downloaded from 2.5 Sample Datasets). The file contains two spreadsheets, one with publications and one with grants. Save each spreadsheet out as grants.csv and publications.csv.
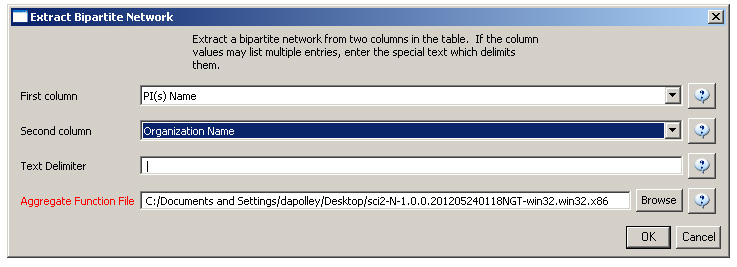
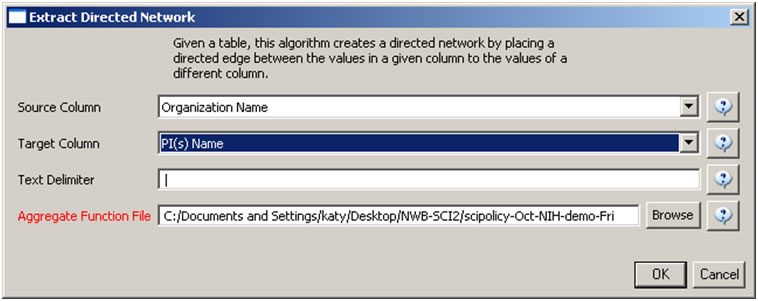
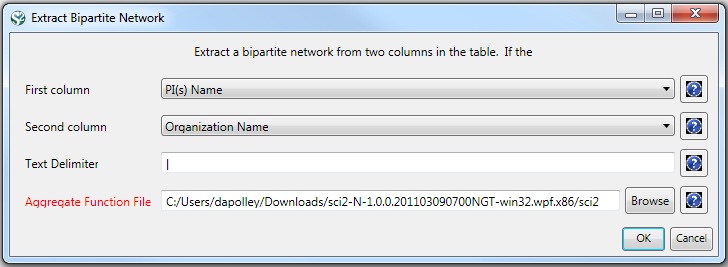
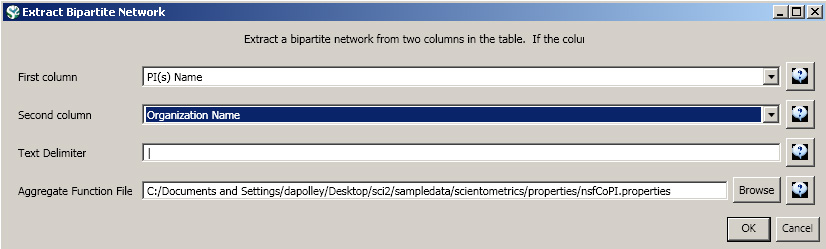
First load grants.csv in the Sci2 Tool using 'File > Load' and 'Standard csv format' in the "Load" pop-up. To view a bimodal network visualizing which main PIs associate with which institution, run 'Data Preparation > Extract Bipartite Network ' with the following parameters:
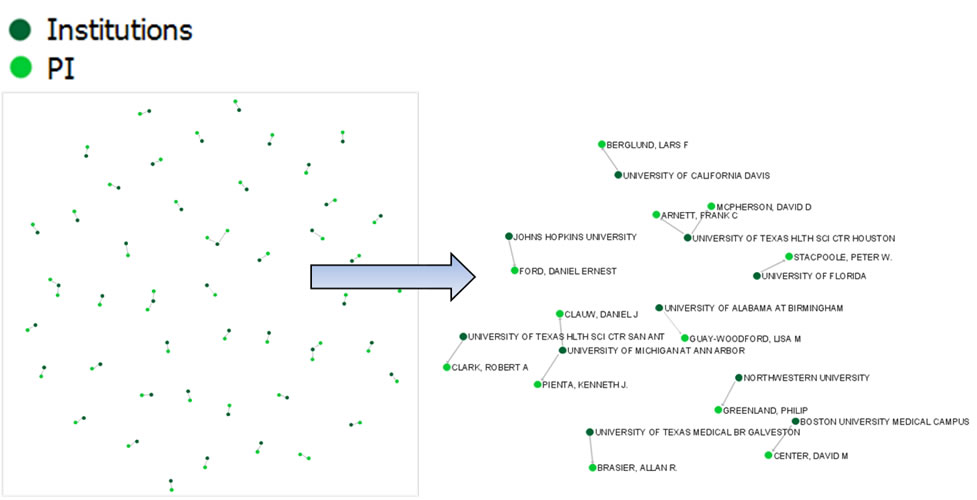
The resulting network can be visualized in GUESS and laid out using GEM, see Figure 5.26
. 
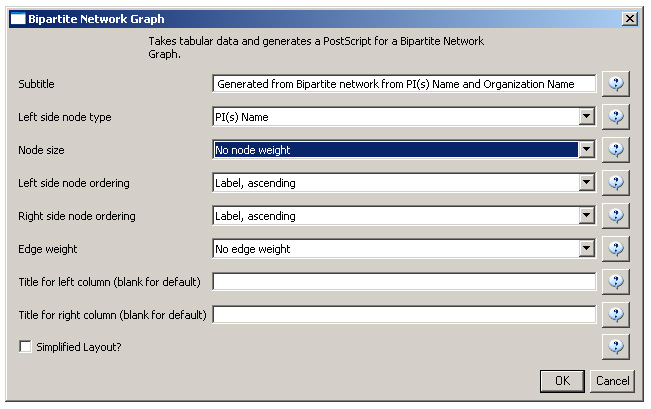
The network can also be visualized with the Bipartite-specific visualization. Run 'Visualization > Networks > Bipartite Network Graph' with the following parameters:
Sci2 will generate a visualization titled "Bipartite Network Graph PS" in the Data Manager. This network visualization can be saved as a PostScript file and the resulting visualization will look like this:
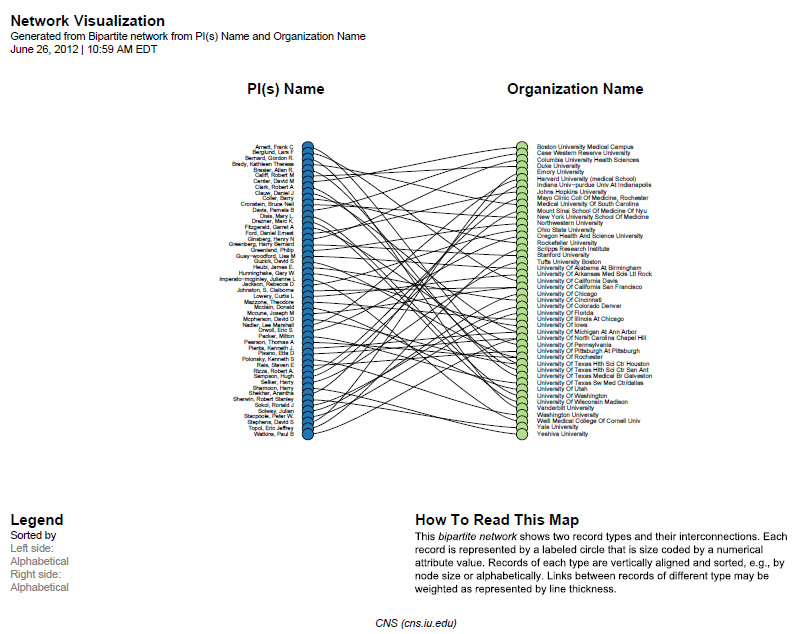
Figure 5.26: Bimodal institution-PI network for CTSA Centers.
Now load publications.csv as a standard csv and create a co-authorship network by running 'Data Preparation > Extract Co-Occurrence Network' with text delimiter set to " ; ". The parameter for Column Name should be set to "author." The resulting co-authorship network has 8,668 nodes, 26 isolates, and 50,129 edges (see Figures 5.27 and 5.28).

Figure 5.27: Co-authorship network of CTSA Center publications
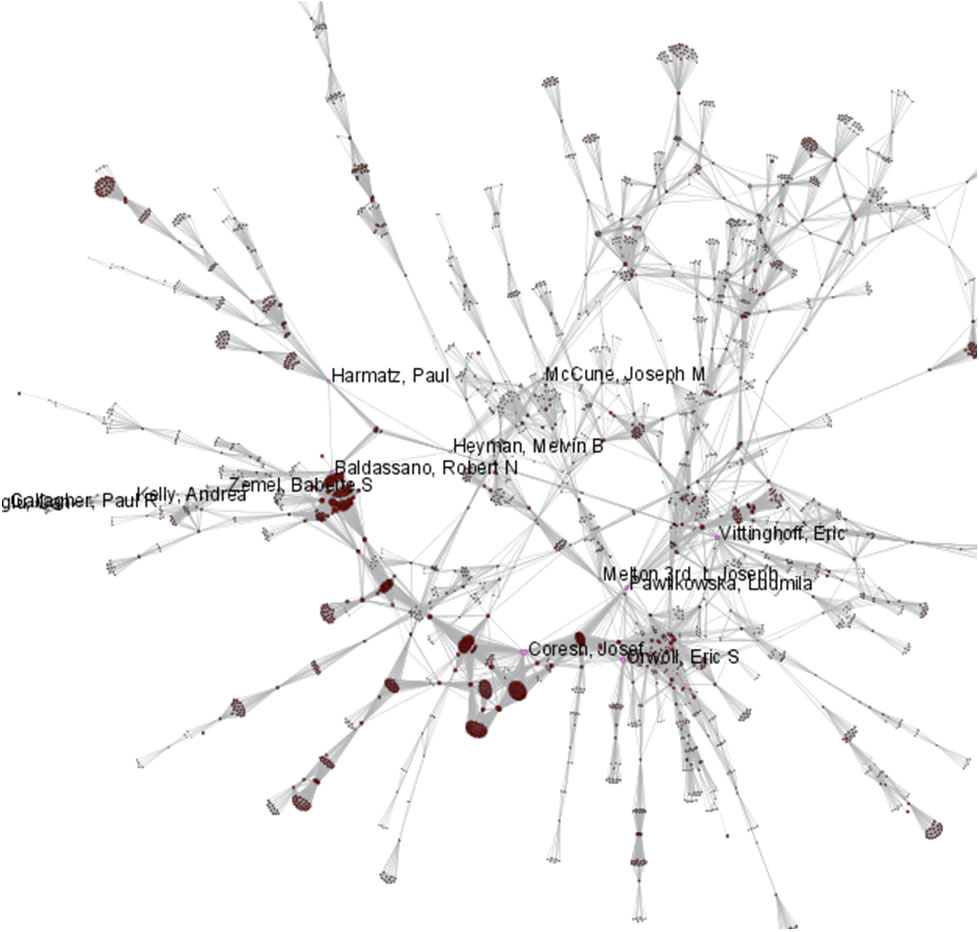
Figure 5.28: Largest connected component of CTSA Center publication co-authorship network
To see the log file from this workflow save the 5.2.2 Mapping CTSA Centers (NIH RePORTER Data) log file.